Use Inspector to improve your tracking plan health
What is Avo Inspector
The first step to better analytics governance is knowing what’s wrong with your data today.
Inspector is a tracking observability solution that helps you uncover issues in your tracking today and prevent shipping broken data to production in the future.
Inspector analyzes tracking calls made by your application across platforms and provides an overview of their structure and volumes in the Inspector events overview, without collecting or processing any user data.
With Inspector, you get an automated audit of the state of your tracking, and ongoing tracking observability moving forward.
Why use Inspector
Teams spend months and years and pay for expensive data audits, only to be left with unrealistic fixes and longer to-do lists. Inspector enables you to stop wasting human hours on detecting and prioritizing issues with your tracking.
Inspector gives you:
- An overview of your current state of tracking, highlighting implementation issues as well as discrepancies with your desired tracking plan.
- Implementation status for every analytics release in your Avo Branch, available for Development, Staging and Production environments. This gives you confidence in and visibility into the status and health of the events that developers are implementing.
- Implementation status for the events in your entire tracking plan, so you can see which events are actually implemented and whether they’re sent correctly or not.
- The ability to seamlessly build your Avo tracking plan on top of live data, with the option to build gradually or through a bulk import directly from Inspector.
How does Inspector work
Inspector extracts the schemas (aka shapes/metadata) of the events you trigger on the client.
Inspector does not process property values or PII data, only event names, property names, and types of properties, and sends those schemas to the Avo servers.
TL;DR: No PII data ever flows through Avo servers; only event schemas.
Start sending metadata to Inspector
There are a few ways to install Inspector to add observability to your events, depending on how you send your events from your product already as well as your preferences.
- CDP Integration (Customer Data Platform): If you are already sending events through a CDP, then this is a great option as it does not require a developer to update your application and release a new version.
- GTM Integration (Google Tag Manager): If you are sending events from GTM, you can use our GTM integration to observe those events
- Inspector SDKs: If you are not sending events through a CDP or GTM, then a developer can install our easy to use SDKs into your application to observe events directly from the source
- HTML tag: This is a good option for those that are using other tag managers than GTM

Does Inspector receive PII data?
No. Inspector does not receive any PII data. Inspector only takes schema metadata, containing event names, property names, and types of properties.
Learn more technical details about the Avo Inspector here.
Property value validation
In addition to schema validation, Inspector Debugger can validate property values against the constraints defined in your tracking plan, such as allowed values, regex patterns, and min/max ranges.
Property values are encrypted end-to-end—Avo only stores encrypted values and cannot decrypt them. You can decrypt values locally in the Inspector Debugger using your private key.
Property value validation is currently available for the Web SDK and Segment integration. Other platforms coming soon.
Learning about Inspector issues and events
After setting up your sources to send data to the Inspector with the direct CDP integrations or Avo Inspector SDKs you will see the data appearing in the the Inspector tab. There are two Inspector overviews available for your incoming data and issues, the Issues view and the Events view – and you can set up Slack Alerts to be notified about new issues.
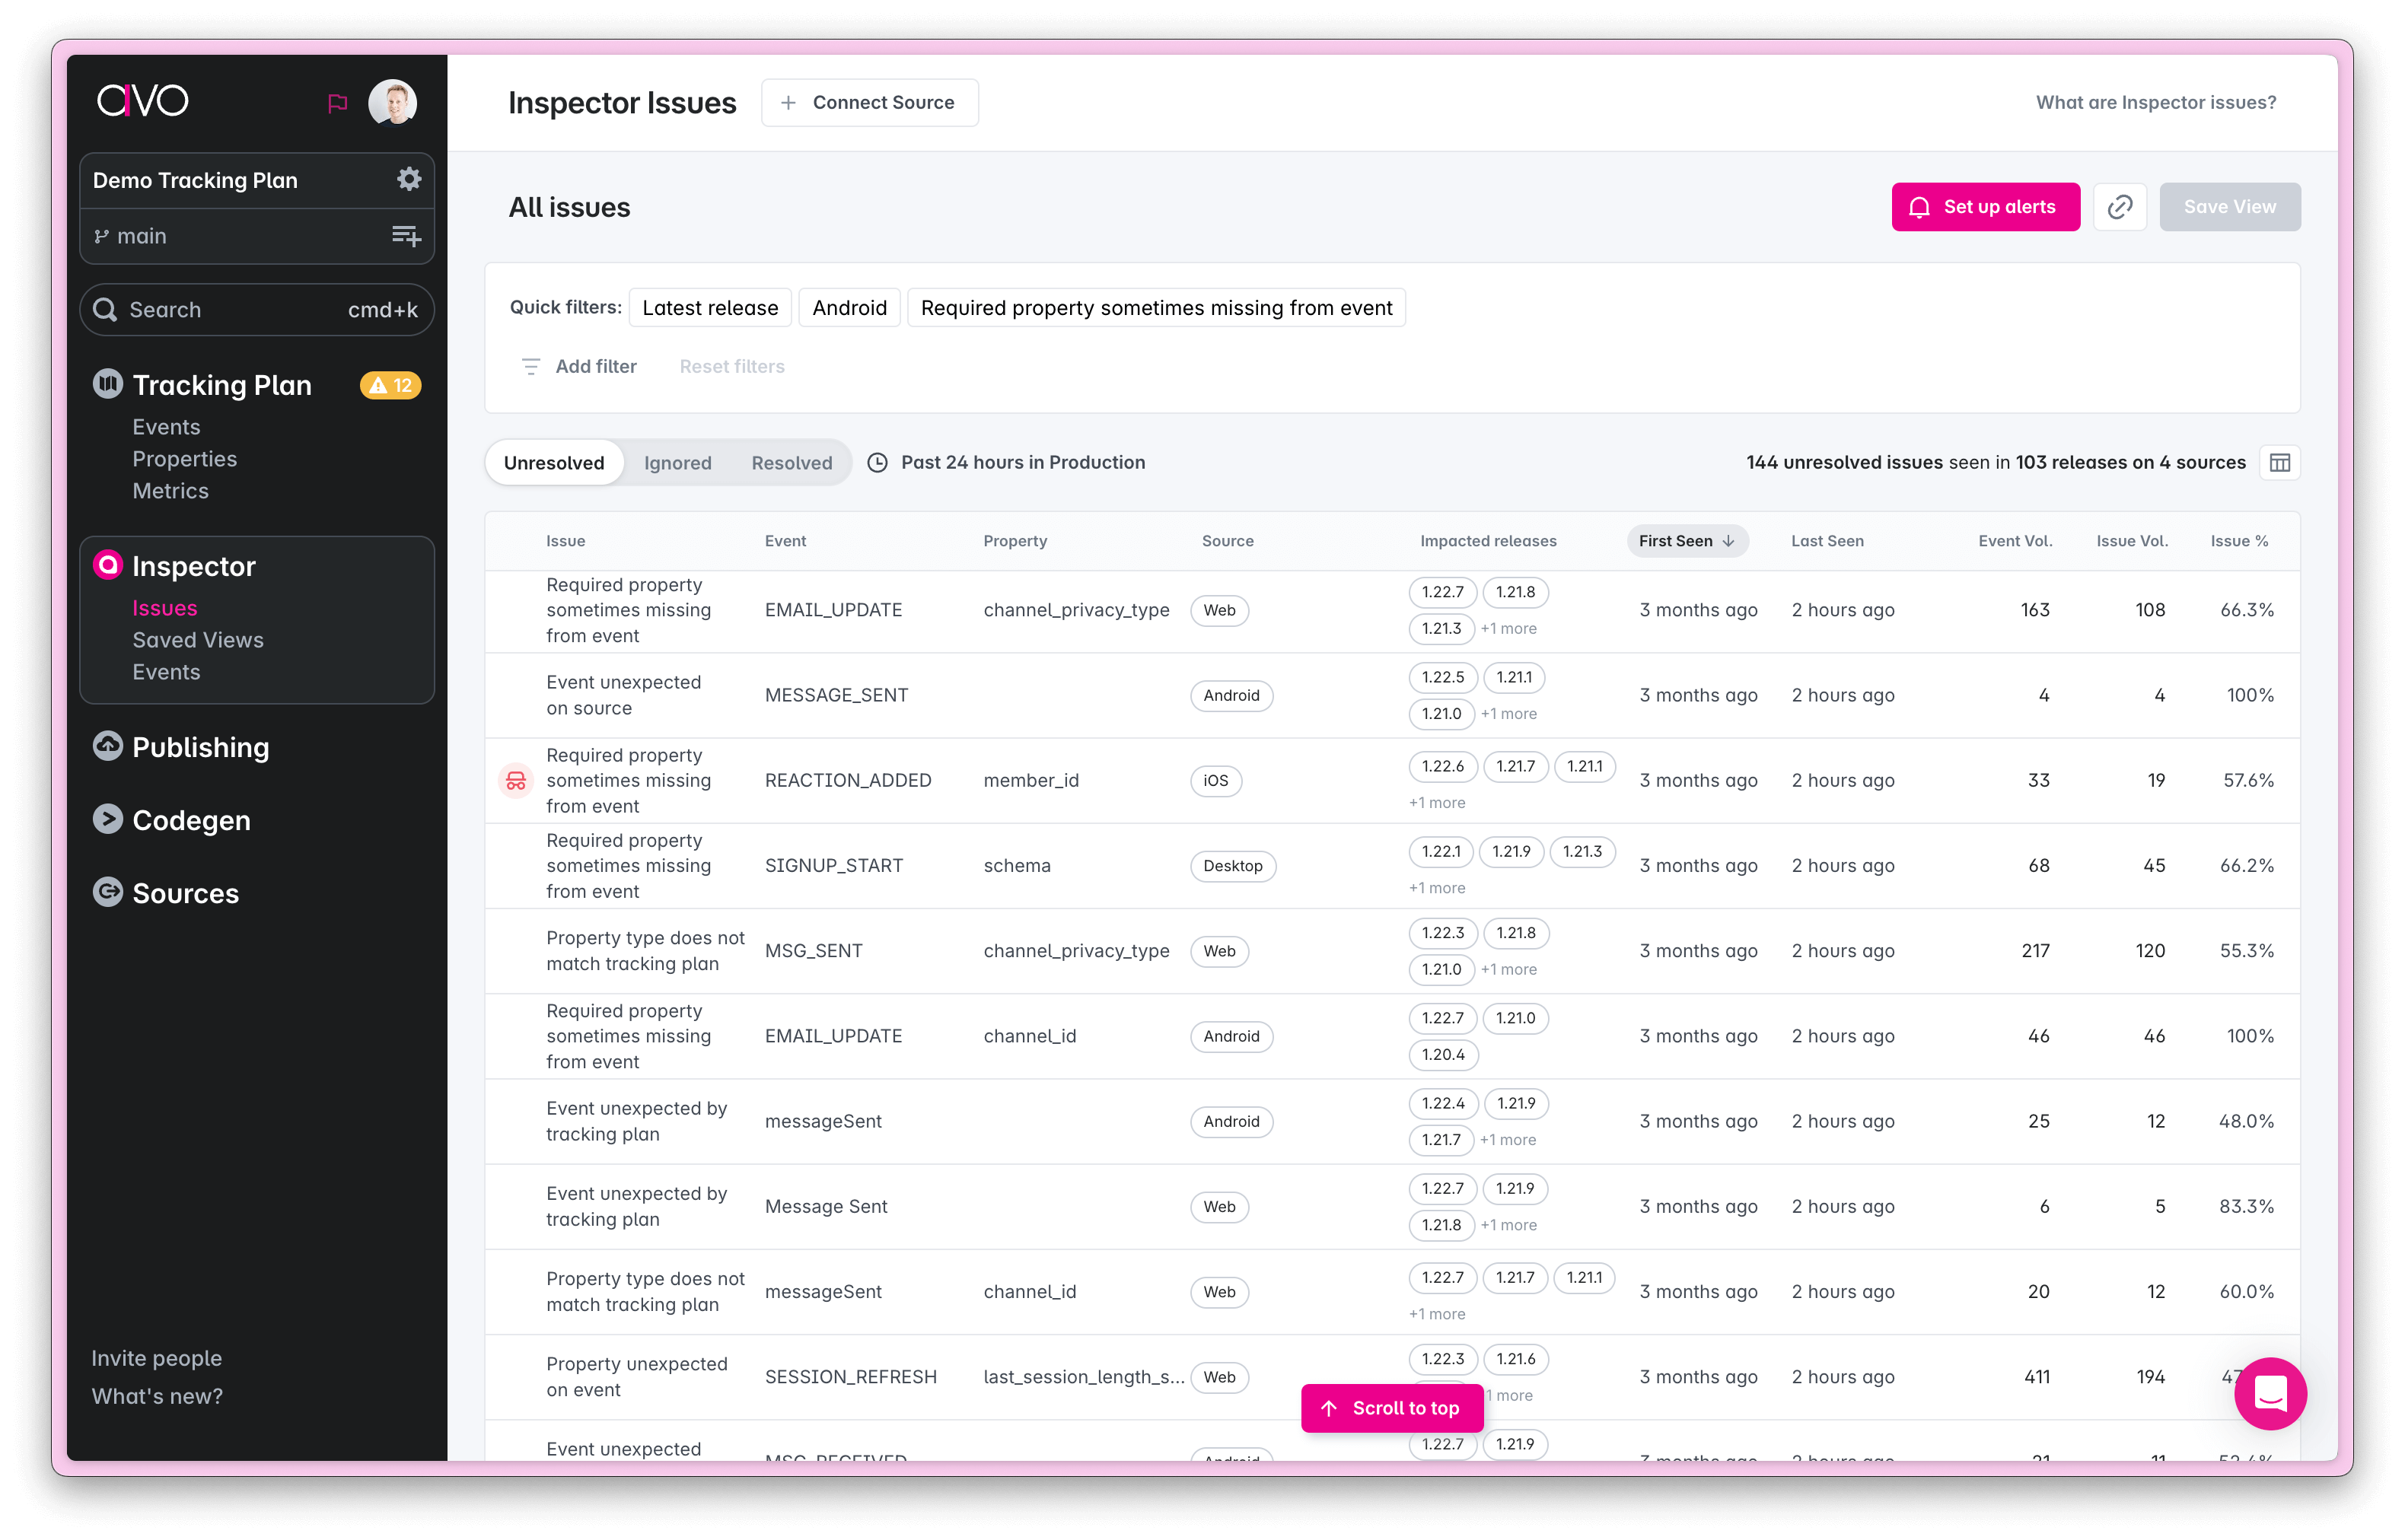
Issues view
The Inspector issues view displays information about anomalies and discrepancies seen in your production data for the past 24 hours. This view allows you to sort and filter issues to uncover those relevant to you and gives you the overview and information needed to prioritize which of them to act on.

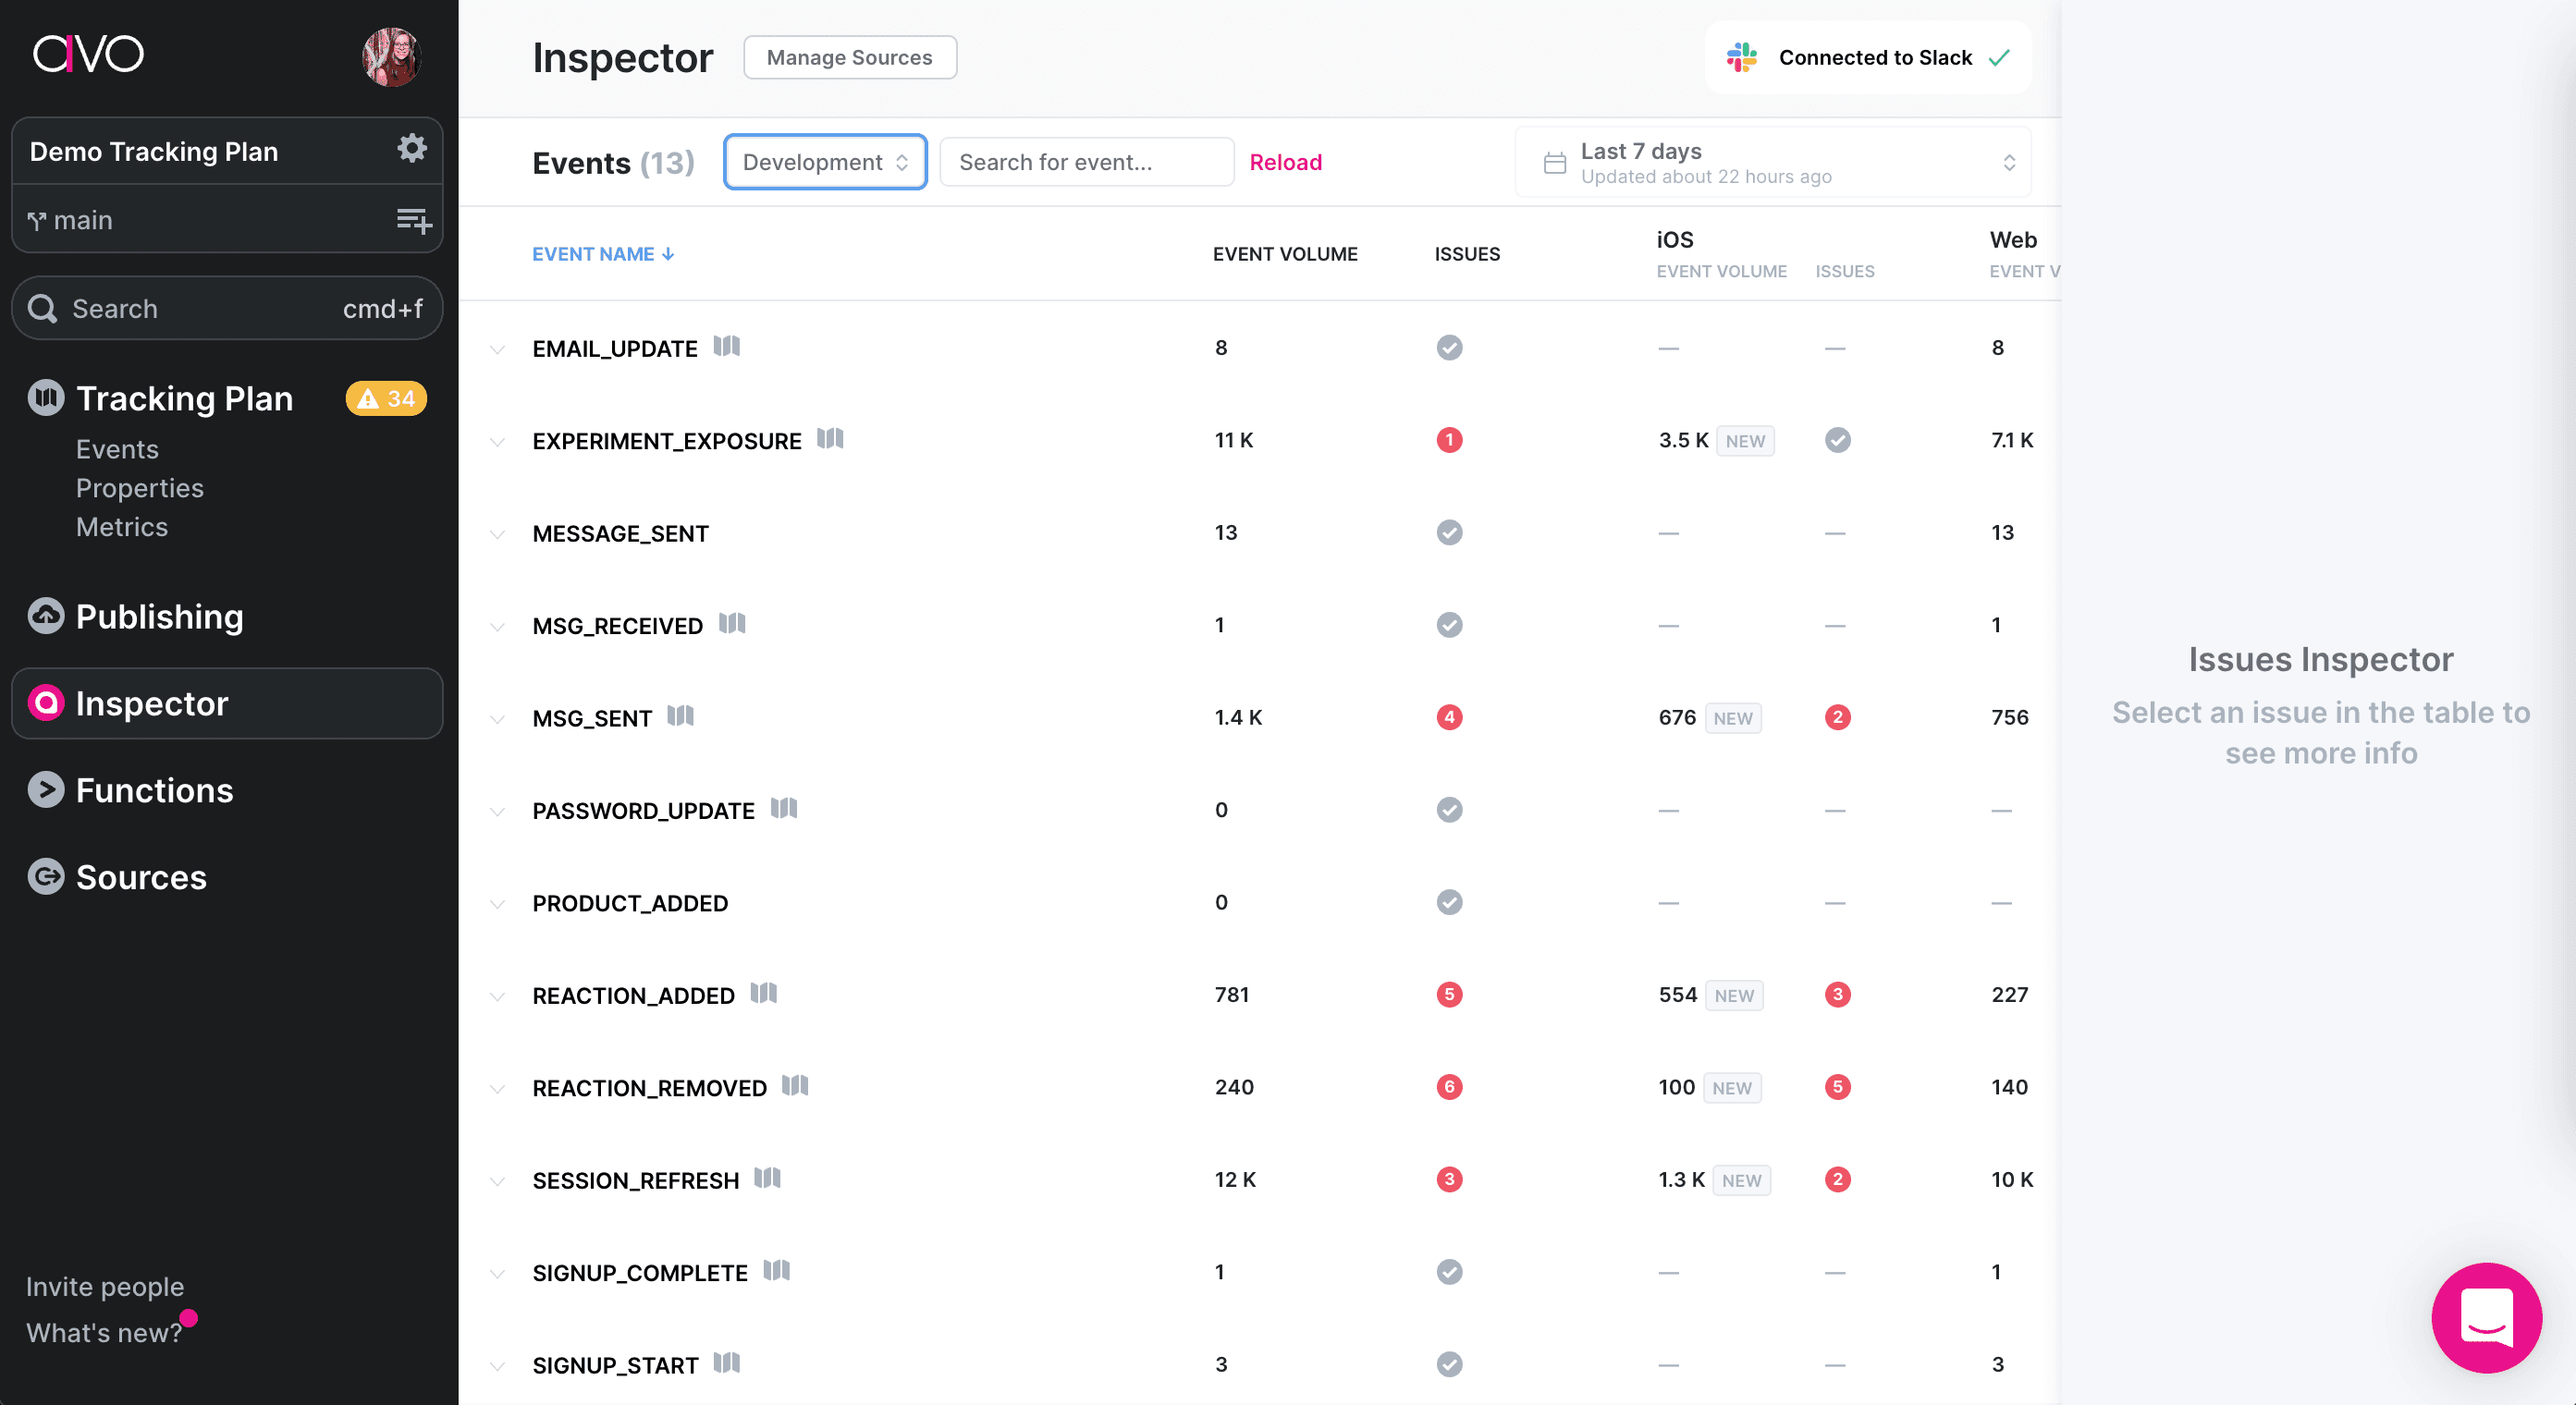
Events view
The Inspector events view provides a report on all event tracking Inspector has seen in your development, staging and production environments. You can use the dashboard to evaluate the health of your tracking implementation and prioritize issues.
The production environment in Inspector is designed to handle large amounts of data and has up to 2 hours delay from receiving events to displaying them on a dashboard.
Events on dev and staging have no delay in processing and will be shown on the dashboard immediately.
Building your tracking plan using Inspector
You can add both events and properties from Inspector, both via the issues view (where you can bulk import events and properties) and the events view (where you can add individual events).
Finding data quality issues
The issues view is great for finding data quality issues that are important to you and your team. There you can sort and filter your issues - and save views to be able to get back to your custom view fast and get alerted when new issues match your criteria.
Fixing data quality issues
Whether your data quality issue is because the implementation is incorrect compared to the tracking plan or the tracking plan is incorrect compared to the data coming in, Inspector provides you with tool to fix your issues.

What’s next?
Now when you’ve set up the Inspector we recommend to start using the mobile debuggers.