Google Tag Manager Source (beta)
This document describes how to send data from Google Tag Manager to Avo Inspector.
The Inspector Google Tag Manager integrations are currently in beta so please reach out to us at support@avo.app or in the chat bubble in the bottom right corner if you have any feedback.
Source Info
- Supports both client side and server side Google Tag Manager
- Inspector events can be verified using the browser developer console by searching for
Avo Inspector. All keys from Avo Inspector contain that name. - Observability can be added to all data layer events using client side GTM in under 90 seconds
- Observability can be added to all Google Analytics events using our server side GTM installation option
- Events detected by Inspector can be added to the Avo tracking plan within the Inspector UI, allowing you to fill a documentation gap on legacy events in seconds
Google Tag Manager (GTM) is a tag management system that allows you to quickly update tags and code snippets on your website, web apps, and apps. Once you deploy the Tag Manager snippet, you can configure (trigger) tags using a web-based user interface without having to alter and deploy additional code. It is common for early stage companies to use Google Tag Manager to take care of dispatching their core analytics events to reduce developer dependencies whenever new events are needed. Typically, as the analytics maturity grow and more accuracy is needed, developers will deploy data layer events in their codebase, and then GTM tag owners will trigger the analytics service events from these data layer events. Learn more about that in this short video.
Getting Started
Avo Inspector requires two core steps to add observability:
- Initializing the Inspector
- Sending your events to Inspector
Both steps have installation options available to you to support different configurations. Which ever path you take, your data observability journey starts with creating an Avo source because this is where you create source specific API keys and can get the initialization code. If you haven’t created a source yet, follow the docs to create and set up your GTM source.
Migrating to v2 and enabling property value validation
Inspector v2 adds support for property value validation — the Inspector can validate actual property values against the constraints defined in your tracking plan, such as allowed values, regex patterns, and min/max ranges. Property values are encrypted on the client before being sent to Avo, so only you can decrypt them.
Generating encryption keys
For key generation instructions, follow the Inspector Debugger docs.
Migrating the GTM Template (client side)
If you are using the Avo Inspector GTM template from the Template Gallery:
- Update the template — Get the latest version of the Avo Inspector template from the Template Gallery. The updated template includes a new optional field: Public Encryption Key.
- Add your public key (optional) — In the Tag Configuration, paste your hex public key into the Public Encryption Key field. Without a key, property values are not sent to Avo.
- Enable in Avo — Go to workspace settings and enable property value validation.
The template is backwards-compatible — existing tags continue to work without changes. The encryption key field is optional.
Migrating the GTM Recipe (client side)
If you imported the GTM recipe:
- Re-download the recipe — Get the latest
GTM-58RX3LLN_workspace19.jsonfrom the gtm-web-recipe repo. The updated recipe loads Inspector v2 which supports encryption. - Re-import into GTM — Import the updated recipe into your GTM container. You may want to merge with your existing tags if you have customized filters.
- Add the encryption key — In the Avo Inspector Init tag, add the following line before
inspector.load():
if ('YOUR-HEX-PUBLIC-KEY') {
  inspector.__PUBLIC_ENCRYPTION_KEY__ = 'YOUR-HEX-PUBLIC-KEY';
}- Enable in Avo — Go to workspace settings and enable property value validation.
If you don’t need property value validation, you can skip step 3 — the v2 SDK works identically to v1 without a key. Without a key, property values are not sent to Avo.
Migrating the GTM Server-side template
If you are using the Avo Inspector server-side GTM template from the Template Gallery:
- Update the template — Get the latest version of the Avo Inspector template from the Template Gallery. The updated template adds event spec validation and stream ID support.
- Configure the environment — Set the environment to
devorstagingto enable client-side event spec validation. In production, events are sent directly without validation for optimal throughput. - Enable in Avo — Go to workspace settings and enable property value validation.
The server-side template validates events against the tracking plan spec in dev and staging environments, checking constraints like allowed values, pinned values, and min/max ranges. Regex validation is not supported in the GTM Server sandbox and is silently skipped.
Encryption is not supported in the GTM Server template due to sandbox limitations (no cryptographic APIs). Property values are not sent to Avo from the server-side template. If property value encryption is required, use the client-side GTM template or a native SDK instead.
Migrating the HTML script tag
If you are using the HTML script tag snippet directly (either in GTM or embedded in your page):
- Update the CDN URL — Change
inspector-v1.min.jstoinspector-v2.min.js:
(t.src = 'https://cdn.avo.app/inspector/inspector-v2.min.js');- Add encryption key (optional) — Add this line before
inspector.load():
inspector.__PUBLIC_ENCRYPTION_KEY__ = 'YOUR-HEX-PUBLIC-KEY';- Enable in Avo — Go to workspace settings and enable property value validation.
The full updated snippet is available in the Web SDK reference.
The v1 CDN bundle remains available at its original URL. Existing integrations that don’t update will continue to work — they just won’t have property value validation support.
Optimizing bundle size for production? If you’re using the NPM package and bundle size is a concern in production, consider using the lite build (~5.2 KB gzipped). Use the full build in dev/staging environments for the complete Inspector Debugger experience including property value validation and session filtering.
Inspector Client side GTM integration with a template
The simplest way to integrate GTM with inspector is to use the Avo Inspector template provided in the official Template Gallery.
Follow the Avo in-app instructions to set up the GTM Template.
Filters in the Avo Inspector Template
Events can be filtered using the Event names to force include, Event names to ignore and Event prefixes to ignore fields in the Tag Configuration.
All fields should be JSON arrays of strings.
Event names to force include has the highest priority, if you add an event there, it will be reported.
Then, if event name matches one of the values provided in Event names to ignore, or starts with any of the Event prefixes to ignore, it will be ignored and not reported to the Inspector.
We provide default values that you can customize as needed.
The same logic applies to event properties, using the Property names to force include, Property names to ignore and Property prefixes to ignore fields.

Other ways to integrate Inspector Client side GTM
There are two extra options to install Inspector via Google Tag Manager. You can either import our GTM recipe to add observability to all data layer events, or use our Inspector function to add observability to individual events. If you choose to use the GTM recipe, the initialization code is already included in a tag, so for the Inspector API GTM variable you need to provide the source specific API key, which you can find in your Avo source Inspector setup. Another option is to initialize Inspector via creating your own HTML tag and using the HTML script you can find in the source Inspector setup.
Importable GTM recipe
To add observability to all data layer events with our importable GTM recipe in under 90 seconds, follow the steps below:
Step 1: Download our GTM recipe here
This is a file in our public Git repo. You can download the raw file in the top right corner of the code part.
Step 2: Import the recipe into your GTM container
Go to the Google Tag Manager container you want to install the Inspector on and import the recipe.
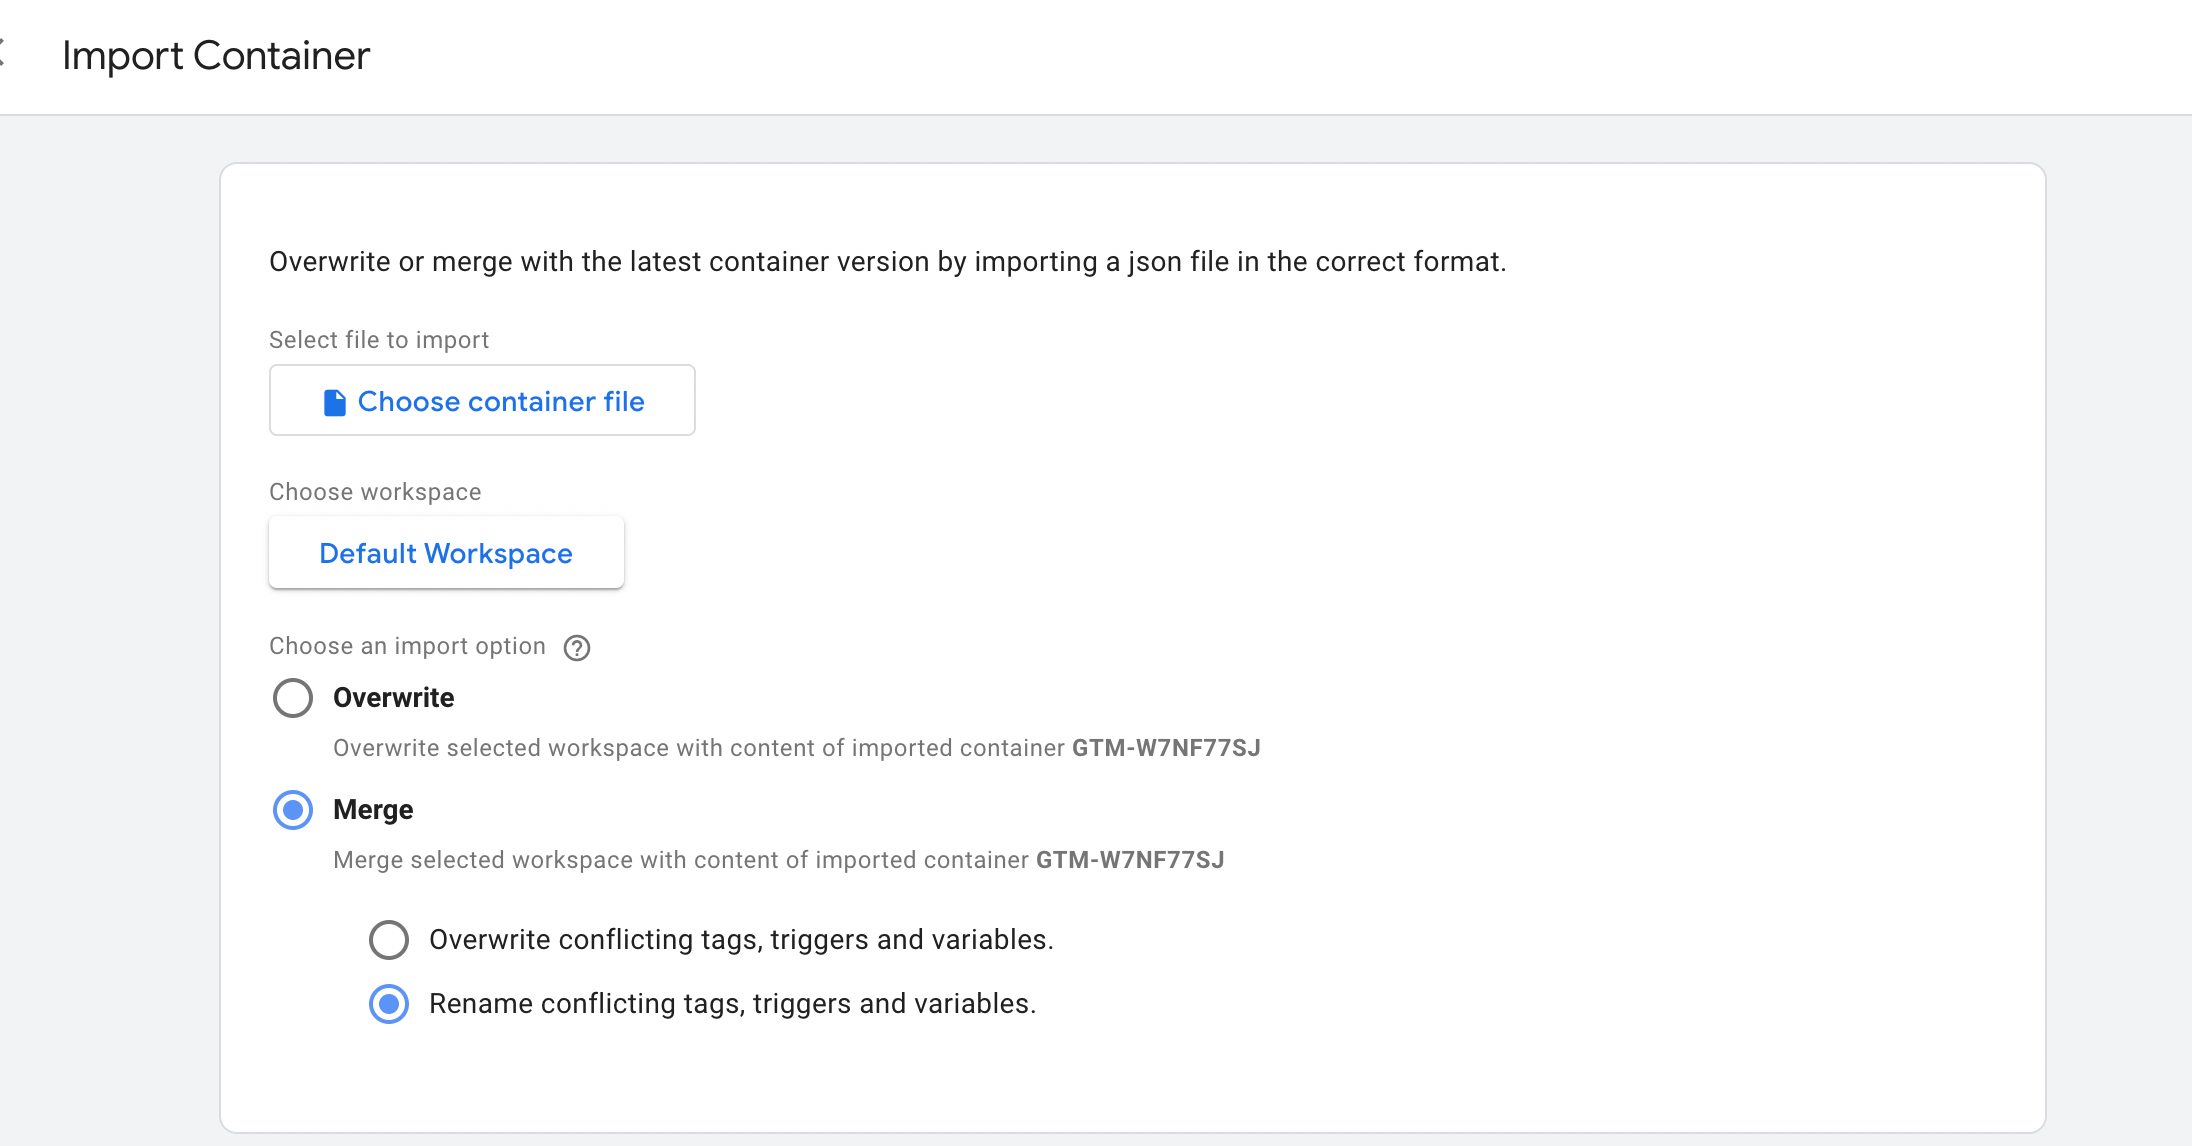
The recipe contains the following tags, triggers and variables:
- Tags
- Avo Inspector Init
- Avo Inspector Send
- Triggers
- All Custom Events
- Initialization
- Variables
- Avo Inspector API Key (required: needs to be populated before initialization)
- Avo App Name (recommended: provide a unique application name)
- Avo Public Encryption Key (optional: add your ECIES public key for property value validation)
- Avo Events To Exclude (optional: add event names to ignore)
- Avo Properties To Exclude (optional: add property names to ignore)
- gtm.uniqueEventId
- Built-in Variables
- Debug Mode
- Event
The only thing that needs to be touched is the Avo Inspector API key.
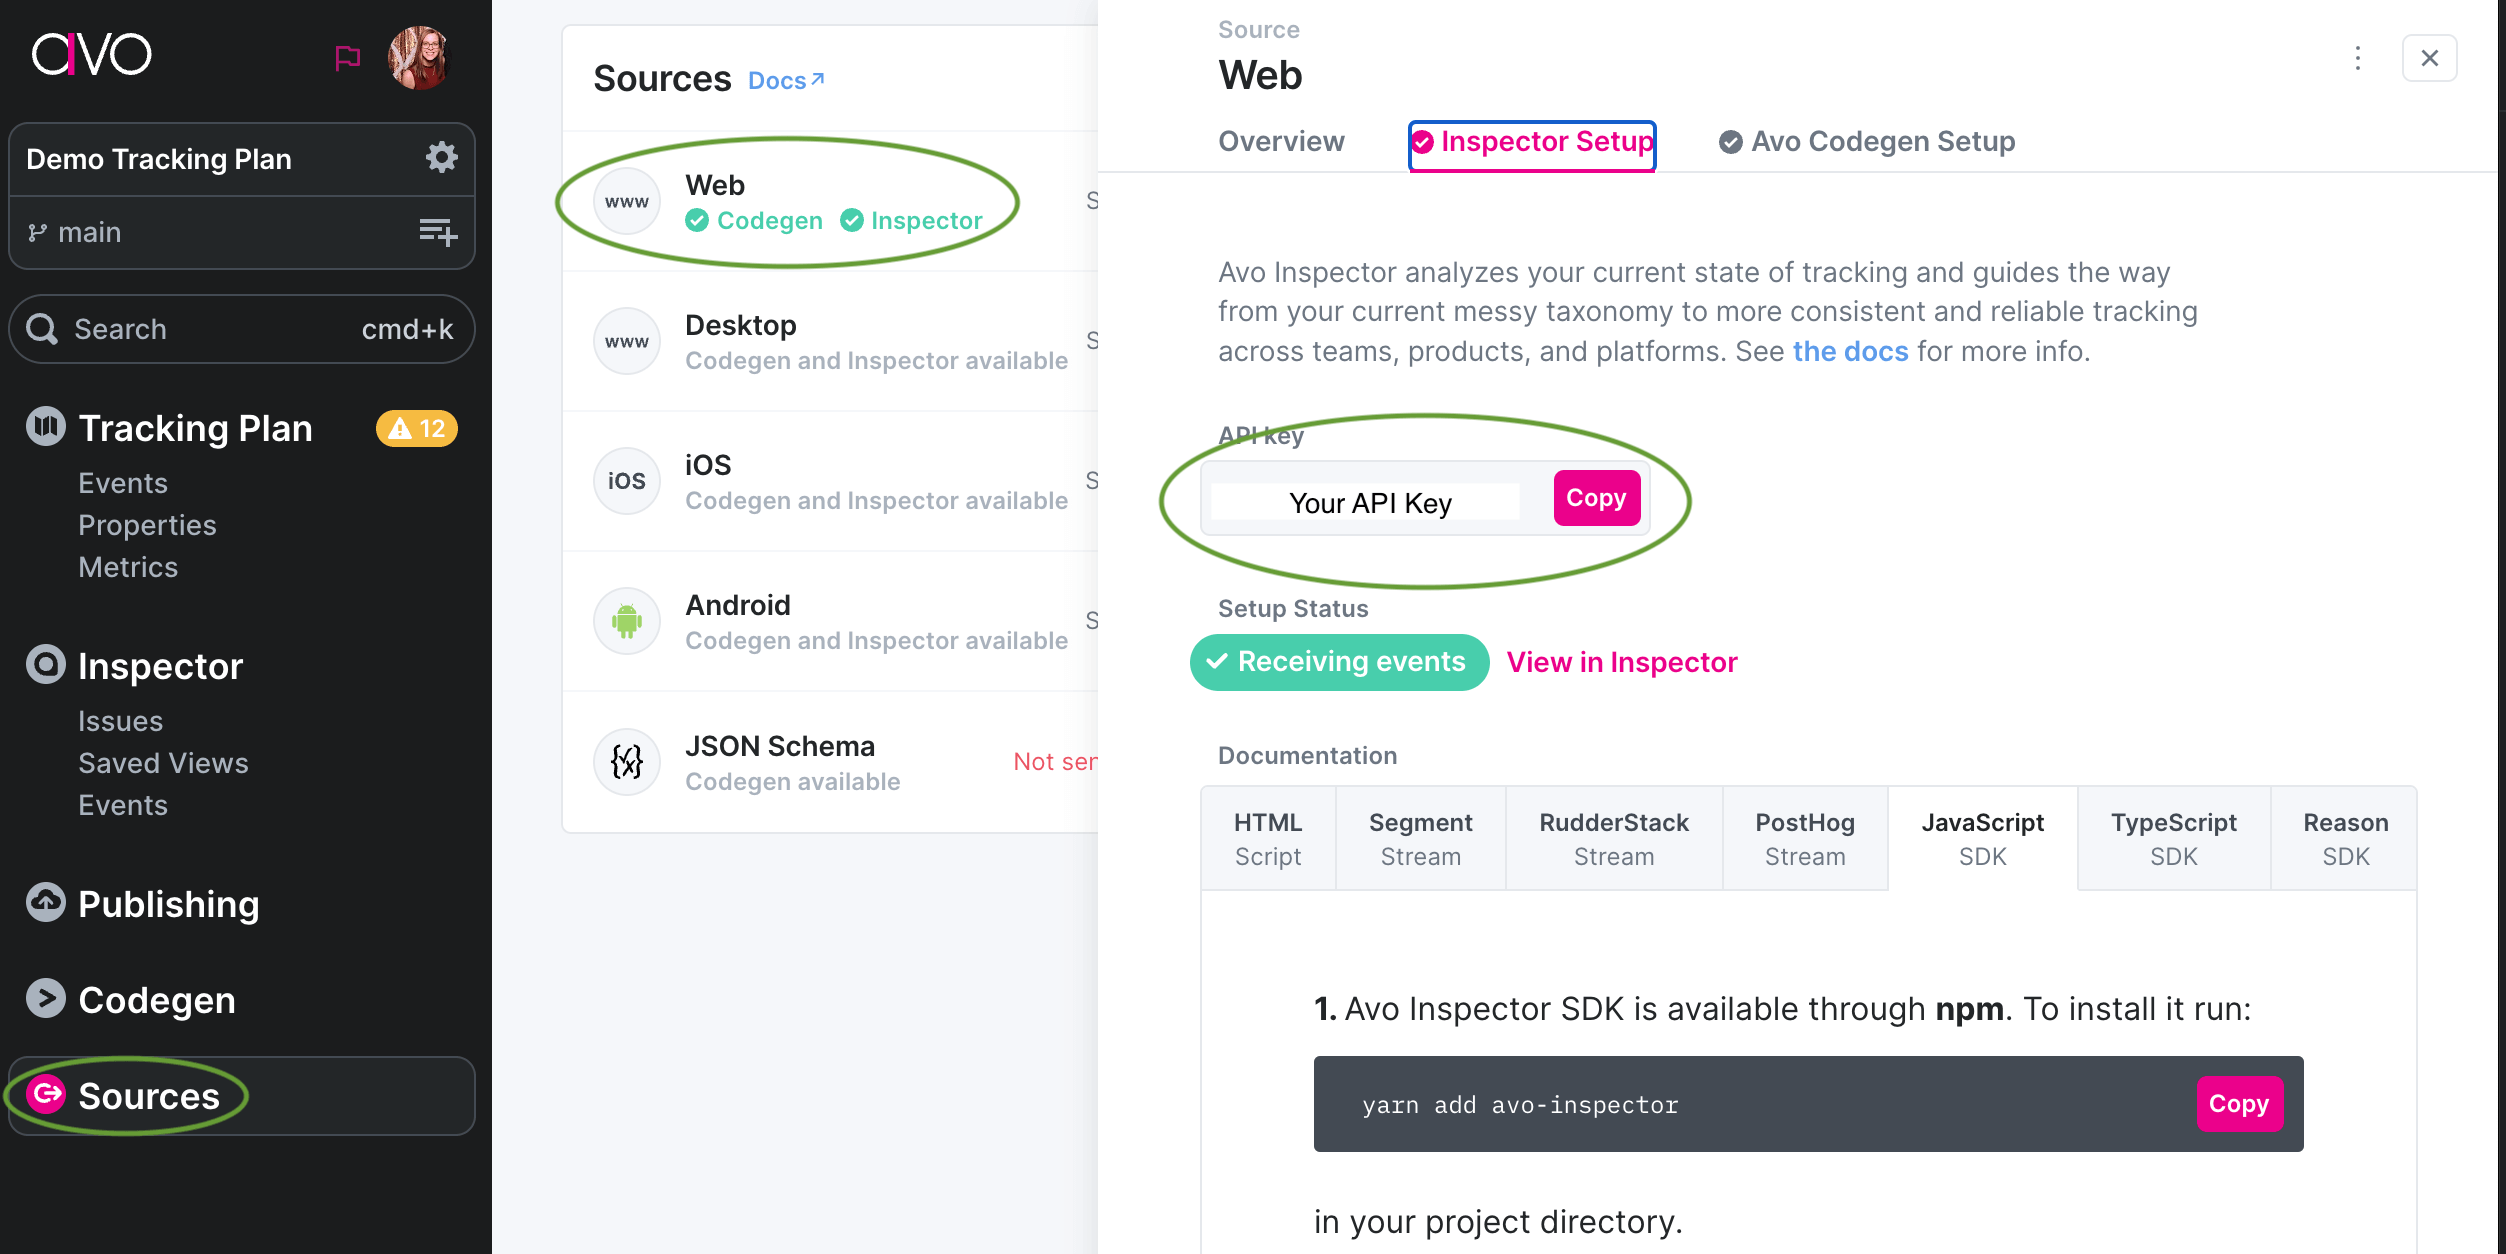
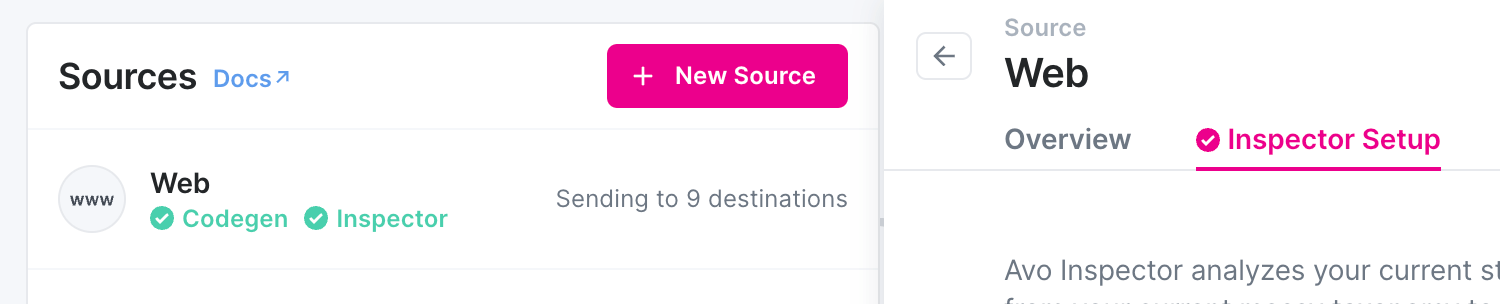
Step 3: Add the source specific Inspector API key
To get the API key, navigate to the Inspector Setup tab of your Inspector source, and copy the API key:
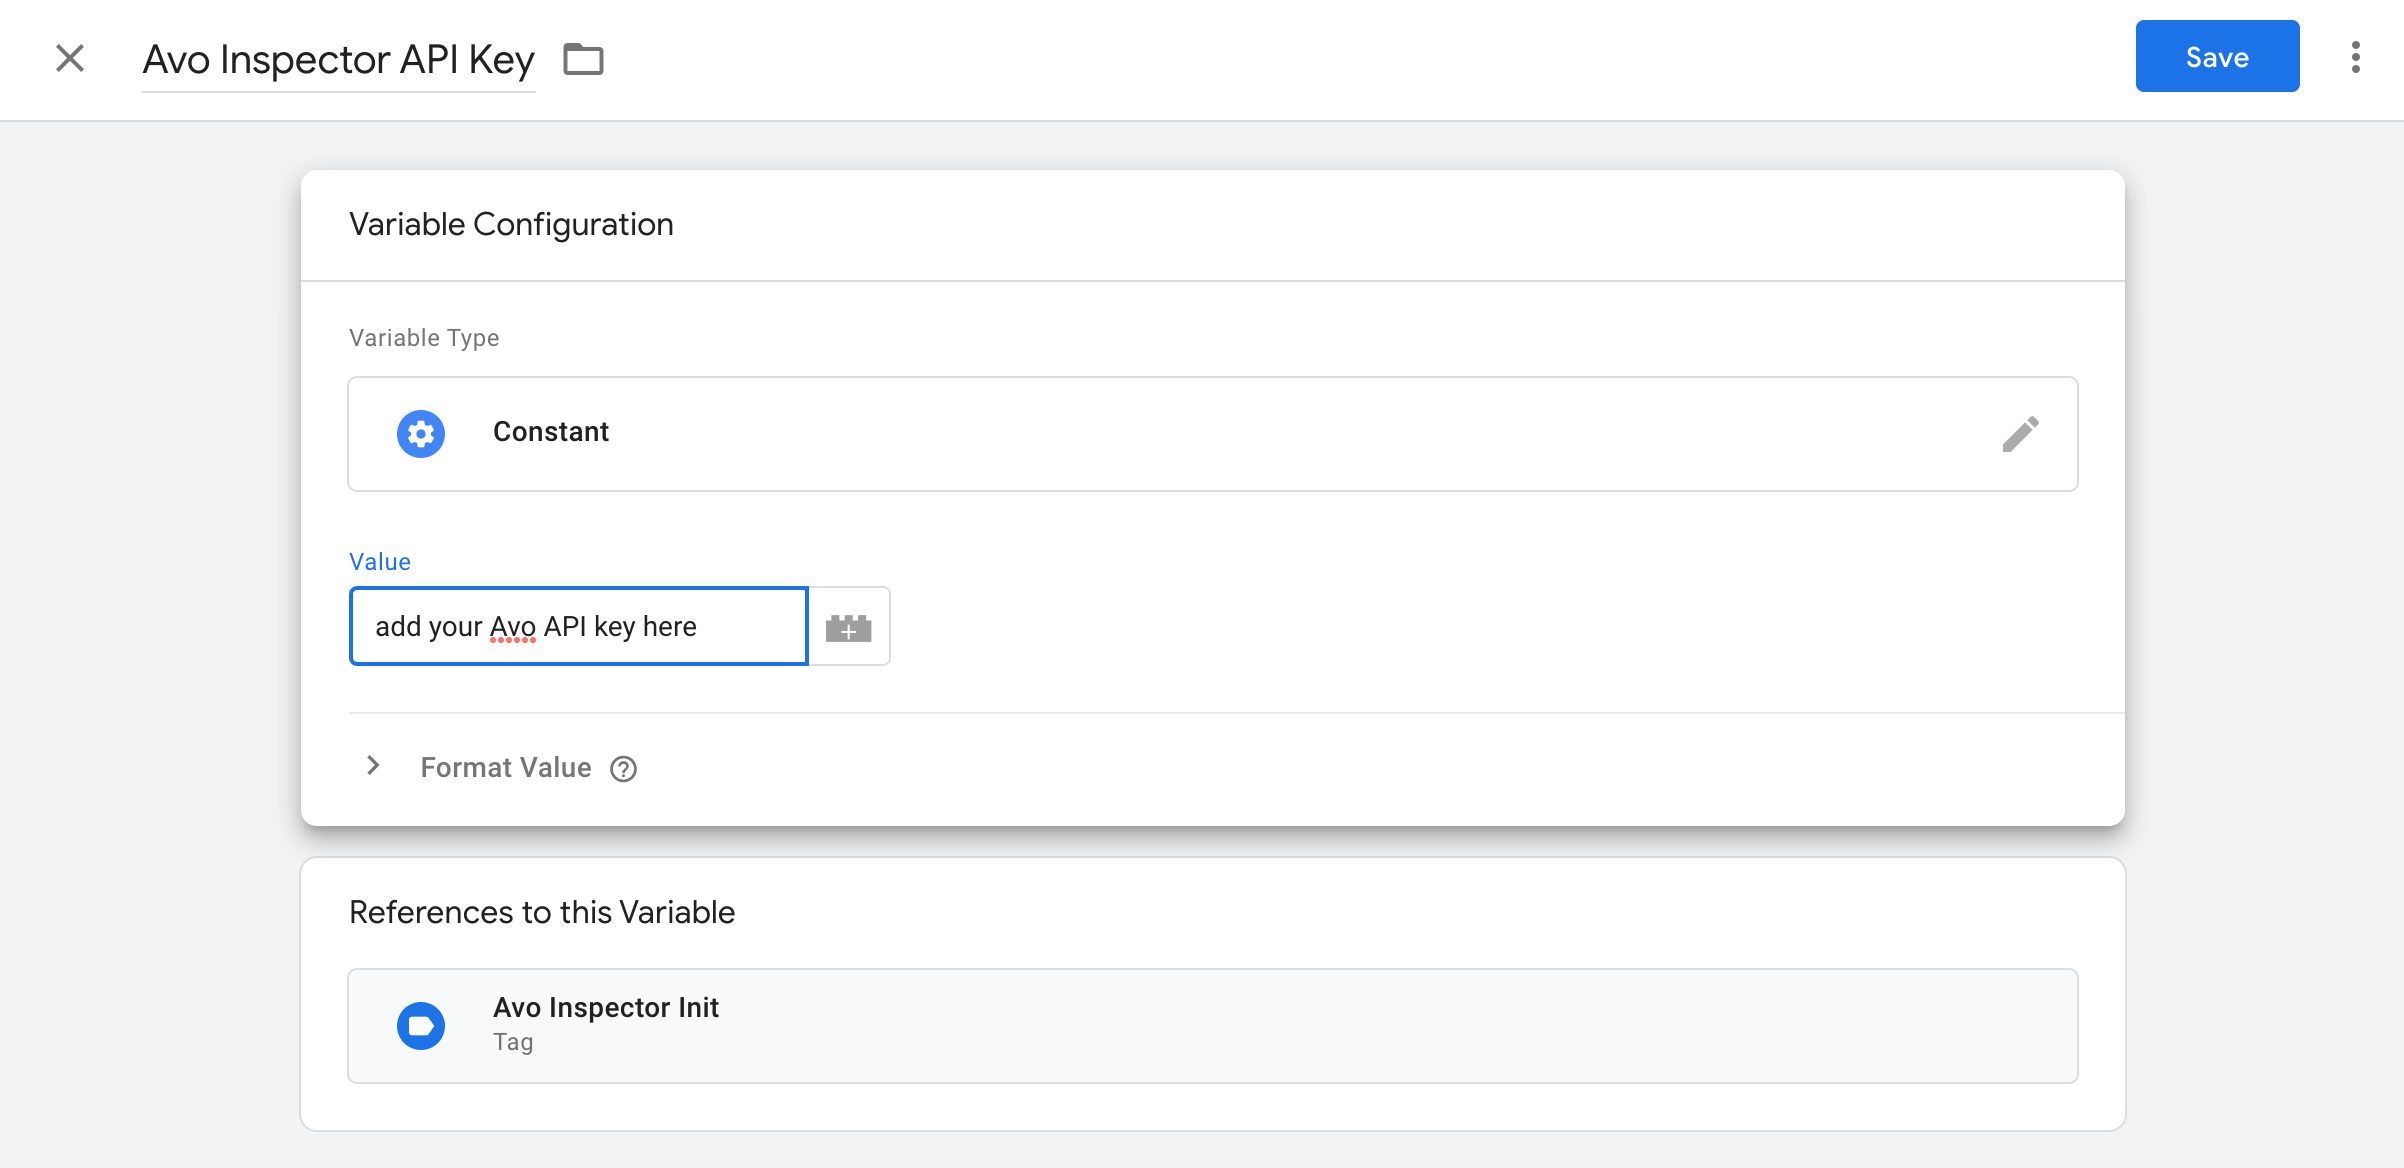
Then go into your GTM container, find the “Avo Inspector API key” variable and paste it there:
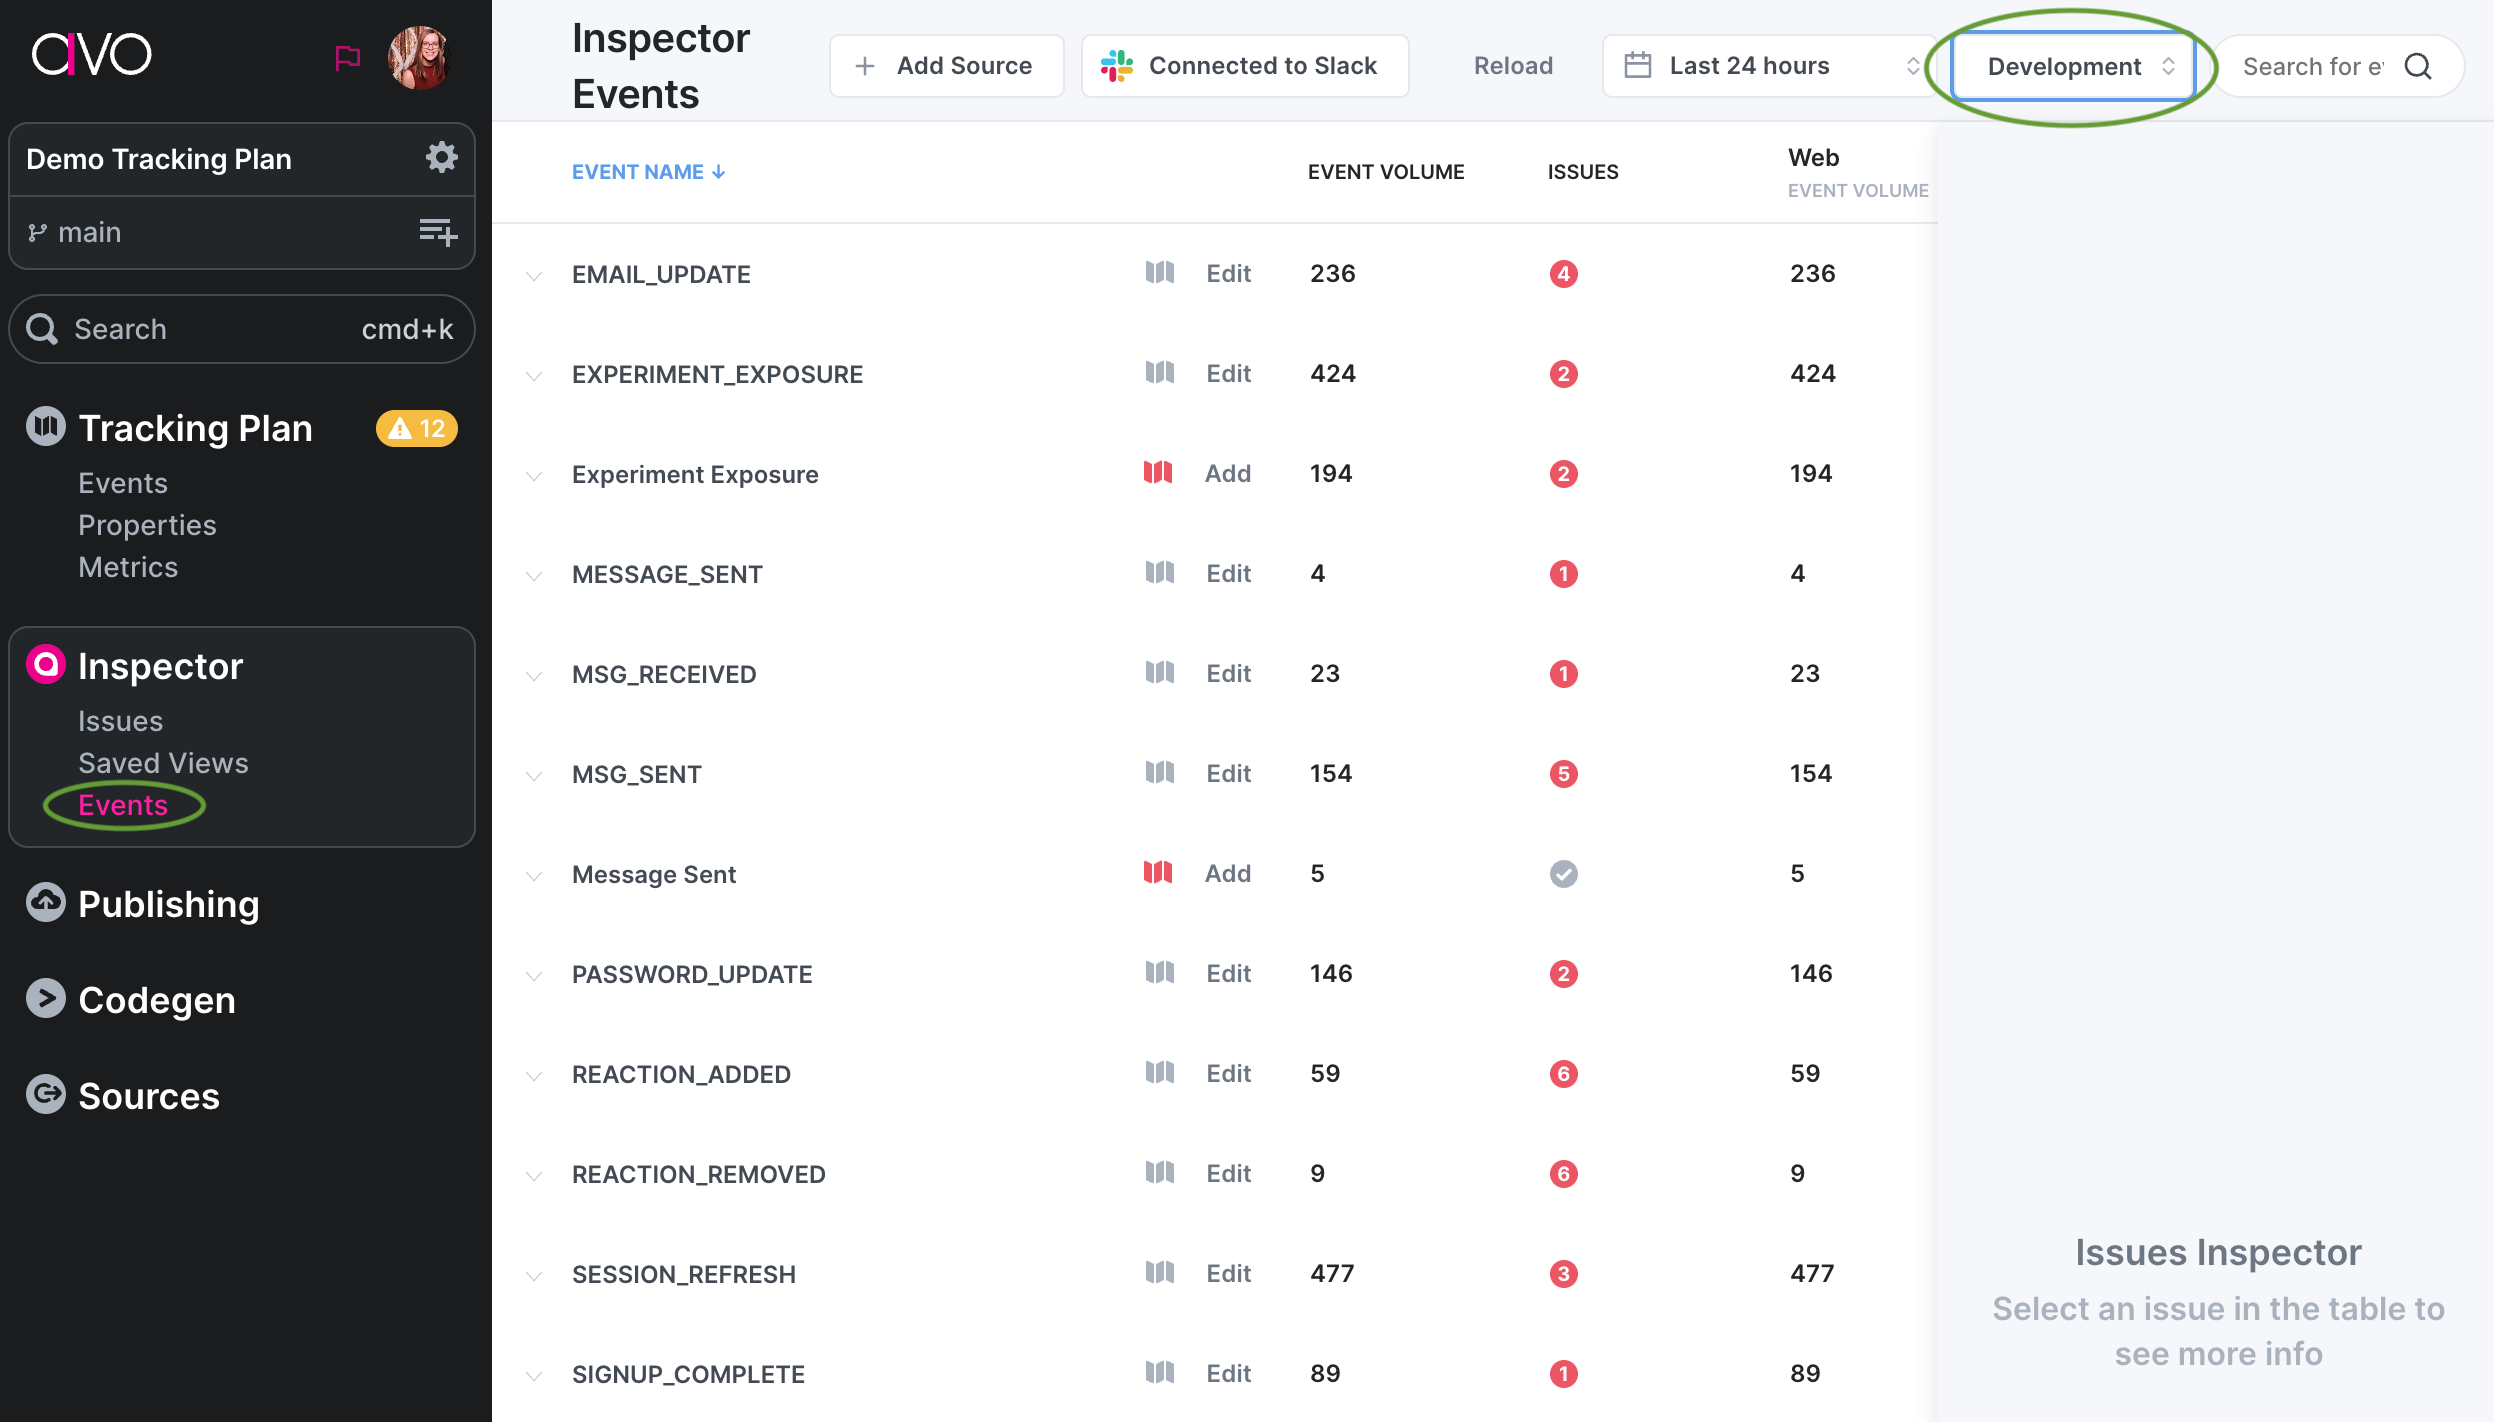
Step 4: Test the GTM tag
The environment is set to development by default when you are running your GTM container in preview mode. We recommend doing that first to make sure that everything is working smoothly. To see development data, open the Inspector Events view and change the environment to dev:
Step 5: Publish the GTM container
Publish your GTM container to set the Inspector live and start observing your data.
Step 6: See your data flowing into the Inspector
When you have published your GTM container, it will start sending data to the production environment in Inspector. We recommend opening the Issues view to see the issues Inspector detects. You can also open the Events view in production to see all events that are coming in, with or without issues.
Note that the Inspector production environment is optimized to handle large volume of data so there will be 1 - 2 hour delay in seeing your data flowing into production.
Step 7: Filter your issues and save a view
If you are getting issues into your issues view, we recommend filtering the issues and creating a saved view that includes issues that you care about. Learn more in our Issues view documentation.
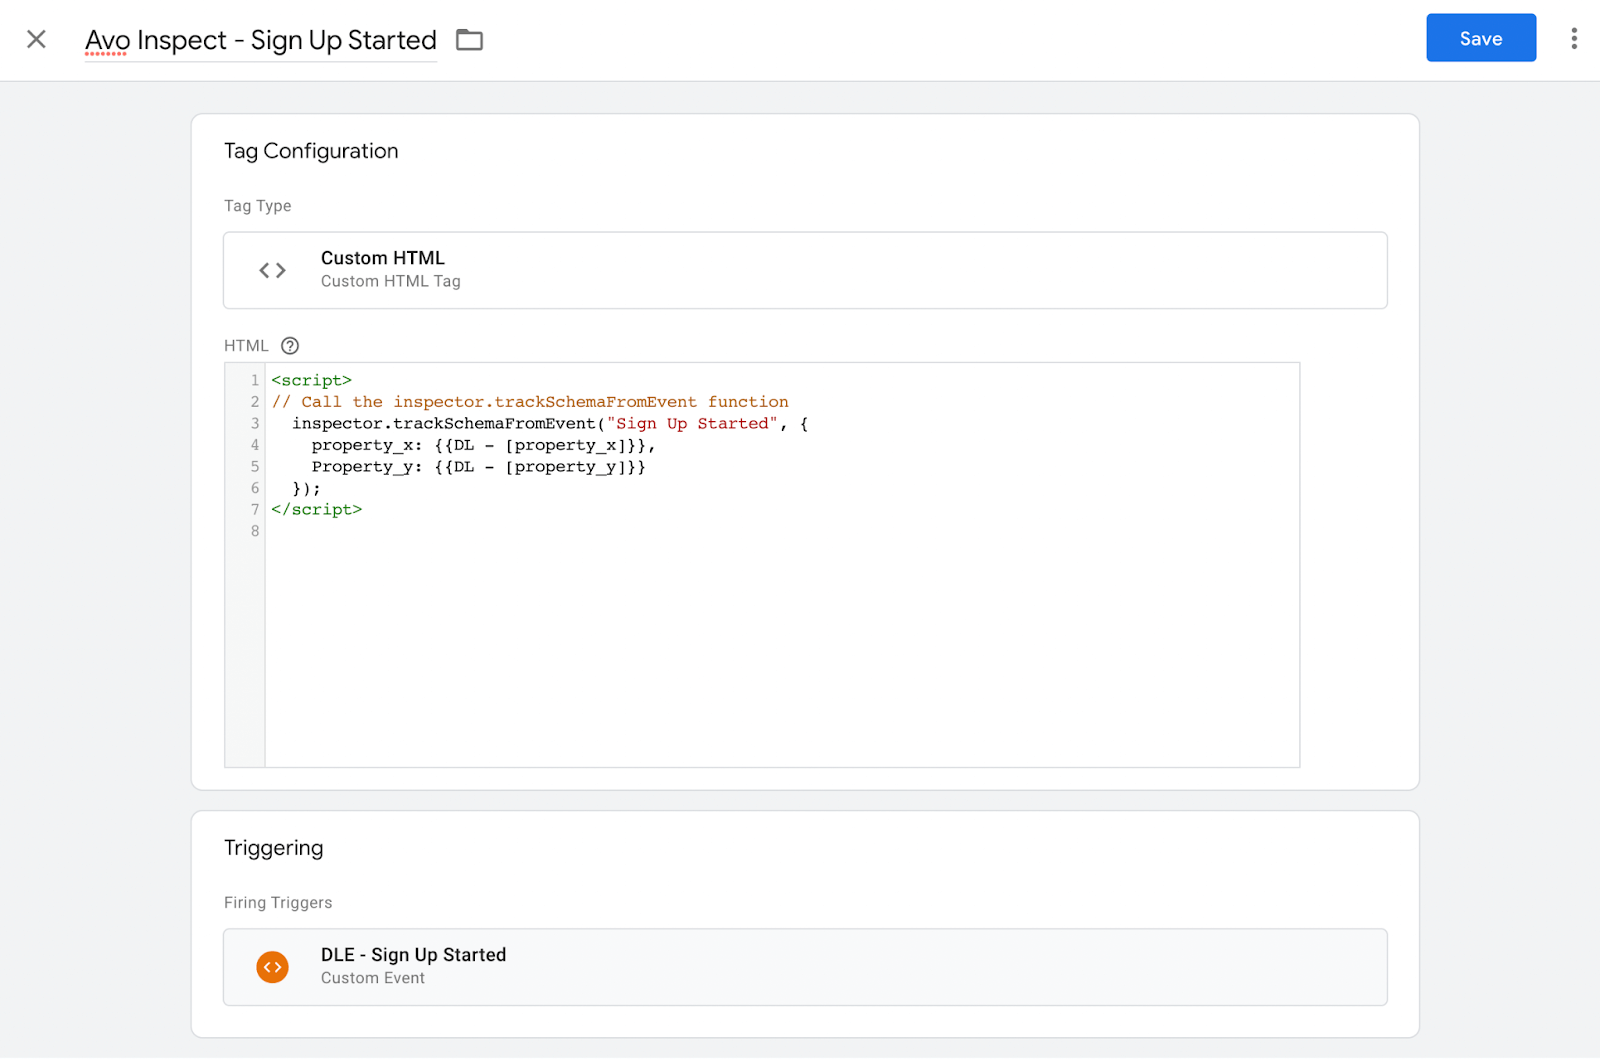
Inspector Get Schema function
To add observability to single events with our Inspector Get Schema function, create a HTML script tag for each event you want to add observability to. The screen shot below provides an example of how the script tag should look like. Make sure to use the same trigger and variables as you are using for the event you’re dispatching to your analytics vendor.
If you have occasions where data layer events could fire before GTM loads and you wish to add observability, we’d recommend initializing inspector outside of Google Tag Manager, and perhaps adding our initialization code to the header of the page or using one of our other Inspector SDKs and adding it more native to your codebase. The flexibility here is a feature.
Notes: While our importable recipe allows you to add observability to all data layer events in production in under 90 seconds, we are aware that many GTM containers are a hybrid of data layer based triggered tags for analytics events, and GTM native ones (think source selectors). If your GTM analytics implementation uses a hybrid trigger setup, to increase Inspector coverage, you could use our recipe to catch all data layer events with a single tag, and then single event Inspector Tags for native GTM trigger based events. If you wanted a single tag that catches both data layer and native GTM triggered events sent Google Analytics 4, for example, ask your developer to code a tag that detects all analytics track calls via the GA4 end point calls, parses the payload, and loops through the properties to then forward the track on to Inspector. We’re currently investigating this for our new recipe.
Inspector Server side GTM integration (beta)
This tag is designed to be used with the server side Google Tag Manager, learn more here
Import Avo Inspector GTM tag template
- In the Tag Templates section, click Search Gallery
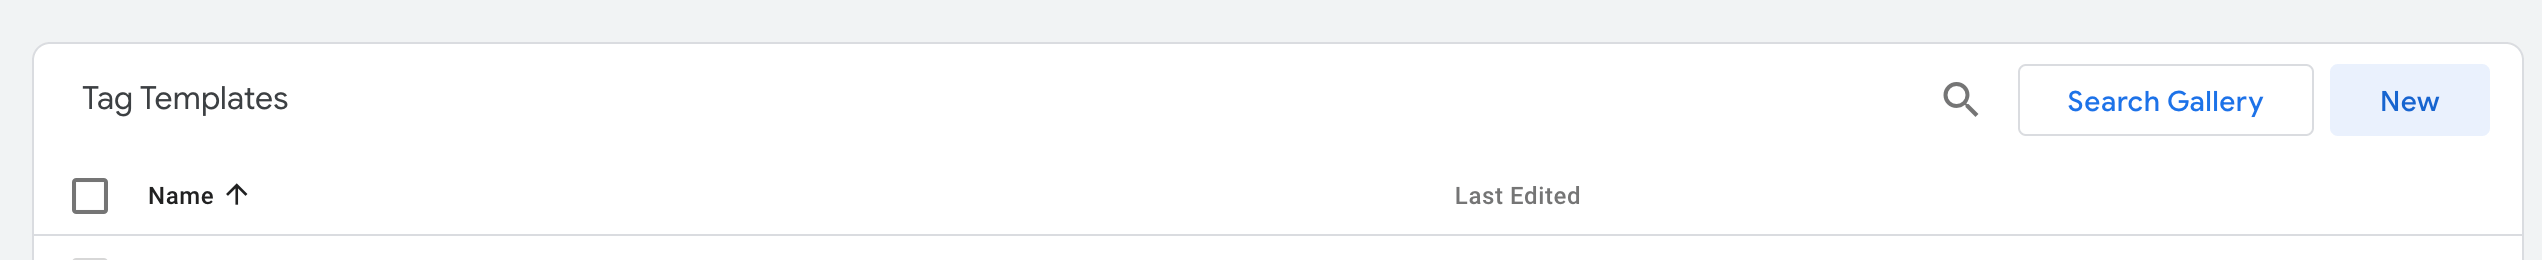
- Search for “Avo Inspector” and press “Add to workspace”. Press “Add” in the following modal.

Create Avo Inspector GTM tag
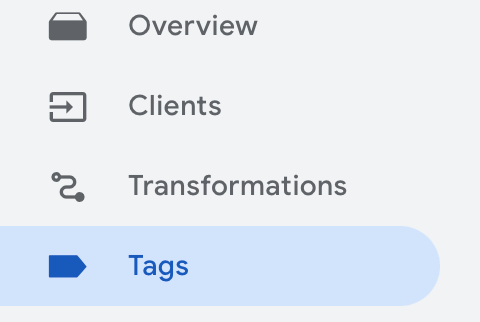
- Navigate to the Tags tab in your server side GTM console
- Click New in the top right

- Click Tag Configuration section and choose Avo Inspector form the options
- Paste you Avo Inspector key. To get the key open your Avo.app workspace, choose the source you want to connect the Inspector to and navigate to the Inspector Setup tab.
- Choose which environment this tag is reporting from. Inspector distinguish development, staging, and production environments. Production is designed for high data volumes, while development and staging are designed for faster time to feedback in the Inspector dashboard. You’ll see your dev and staging events in the Inspector dashboard almost instantly, while the production events can take up to an hour to appear
- Add a trigger, it’s best to analyze all events in Inspector. We suggest to add a trigger that accepts all events, for example with the
.*regex. Make sure that you are only sending the events from the environment configured on the step 3. Learn more about defining triggers here - Now all the data sent to this server side GTM will be analyzed by Inspector. Learn more about sending data to the server side Tag Manager here
Error response from API
The calls to the API are fire and forget, so the API tries to return 200 if it can.
The API will accept multiple events in a batch, and returns a 200 with {"ok": true} if all the events managed to get processed.
If any of the events were invalid or if the API failed to decode them, it will return a 200 response, with
{"ok": false, "errors": [{"message": <Error message>, "json": <jsonString>}]} which contains the Json for each event that failed.