Visual debuggers
When testing analytics on web and mobile apps it’s hard to know if the events are being sent successfully or not, and if they are being sent at the correct time.
Our Visual Debuggers provide a way to control the events flow in your app, making testing analytics way easier and pleasant in web and mobile products.
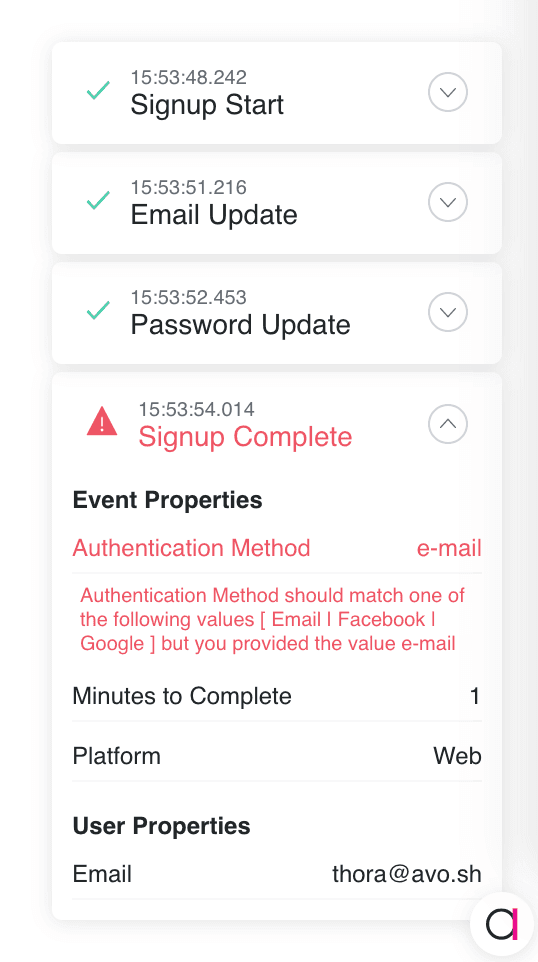
Each analytics event sent with Avo will automatically show up in the debugger with timestamp and all the properties.
If Avo detects errors the visual debugger will highlight those.
Accessing the web debugger
Currently the web visual debugger is only available when you use Avo Codegen.
The debuggers are on by default in development but can be accessed in production:
On web, add the ?avo_debug=1 query parameter to the URL.
Example: https://example.com/checkout?avo_debug=1.
Accessing mobile debuggers
Mobile debuggers are bundled with Inspector SDK on iOS and Android.
Ask a developer to integrate the debugger into your application and provide a way to toggle it following this guide.
How it looks
Here is a demonstration of the mobile debugger in a simple music player app.
| Android | iOS | React Native |
|---|---|---|
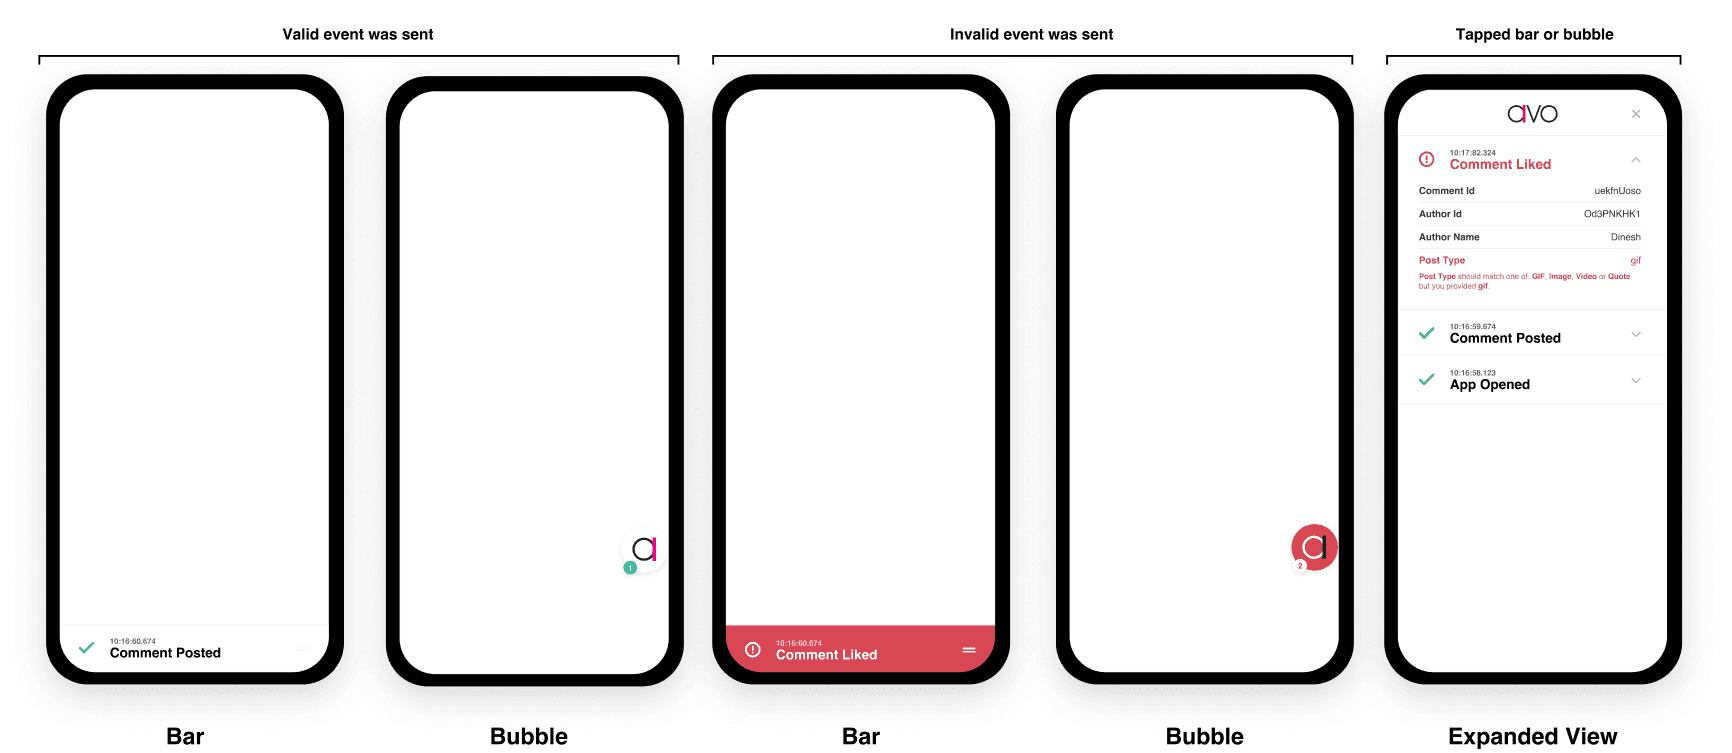
The debugger have 2 visual presentation modes - bubble and bar. Both are draggable, so you can place them at a suitable spot in your app. You can switch between presentation mods without loosing the data.
Press the debugger to see the list of registered events.