Documenting Downstream Dependencies in Avo
Using Categories, Metrics and tags
A lot of teams want to be able to document their downstream dependencies in context with their events. Important dependencies can for example be marketing campaigns, KPI dashboards, email triggers and more. It can be important to make sure that someone that is making changes to an event, knows what depends on it, such that they can make sure to talk to the right people or be extra careful if the dependencies are important.
In this best practice guide we’ll take a couple of examples on how these dependencies can be documented in context with the analytics events in Avo, using categories, metrics and tags.
Marketing campaigns
This is a very common dependency that we don’t want to mess up. If we’re spending money on a marketing campaign, we want to know how it’s doing. Depending on how granularly you want to document your marketing campaigns, you can create a single marketing campaign category or have a category per campaign. We’ll take examples of both below:
Single Marketing Campaign Category
One way to associate a marketing campaign with your events in Avo is to create a marketing campaign category and metrics representing all marketing campaigns. This way is good for teams that focus on associating the marketing campaign itself and have a single main metric to measure it’s success.
To create a single marketing campaign category:
- Go into the Metrics tab of the Tracking Plan
- Click ”+ Add Category”
- Give your category a name (e.g. Marketing Campaigns) and a description
- Create metrics for the marketing campaigns you want to document in the category
- (Optional) Add events that are significant for marketing campaigns to the category
This way, you will be able to see that this event is a part of the “Marketing Campaigns” category in the event view, as well as which marketing campaign as a metric.
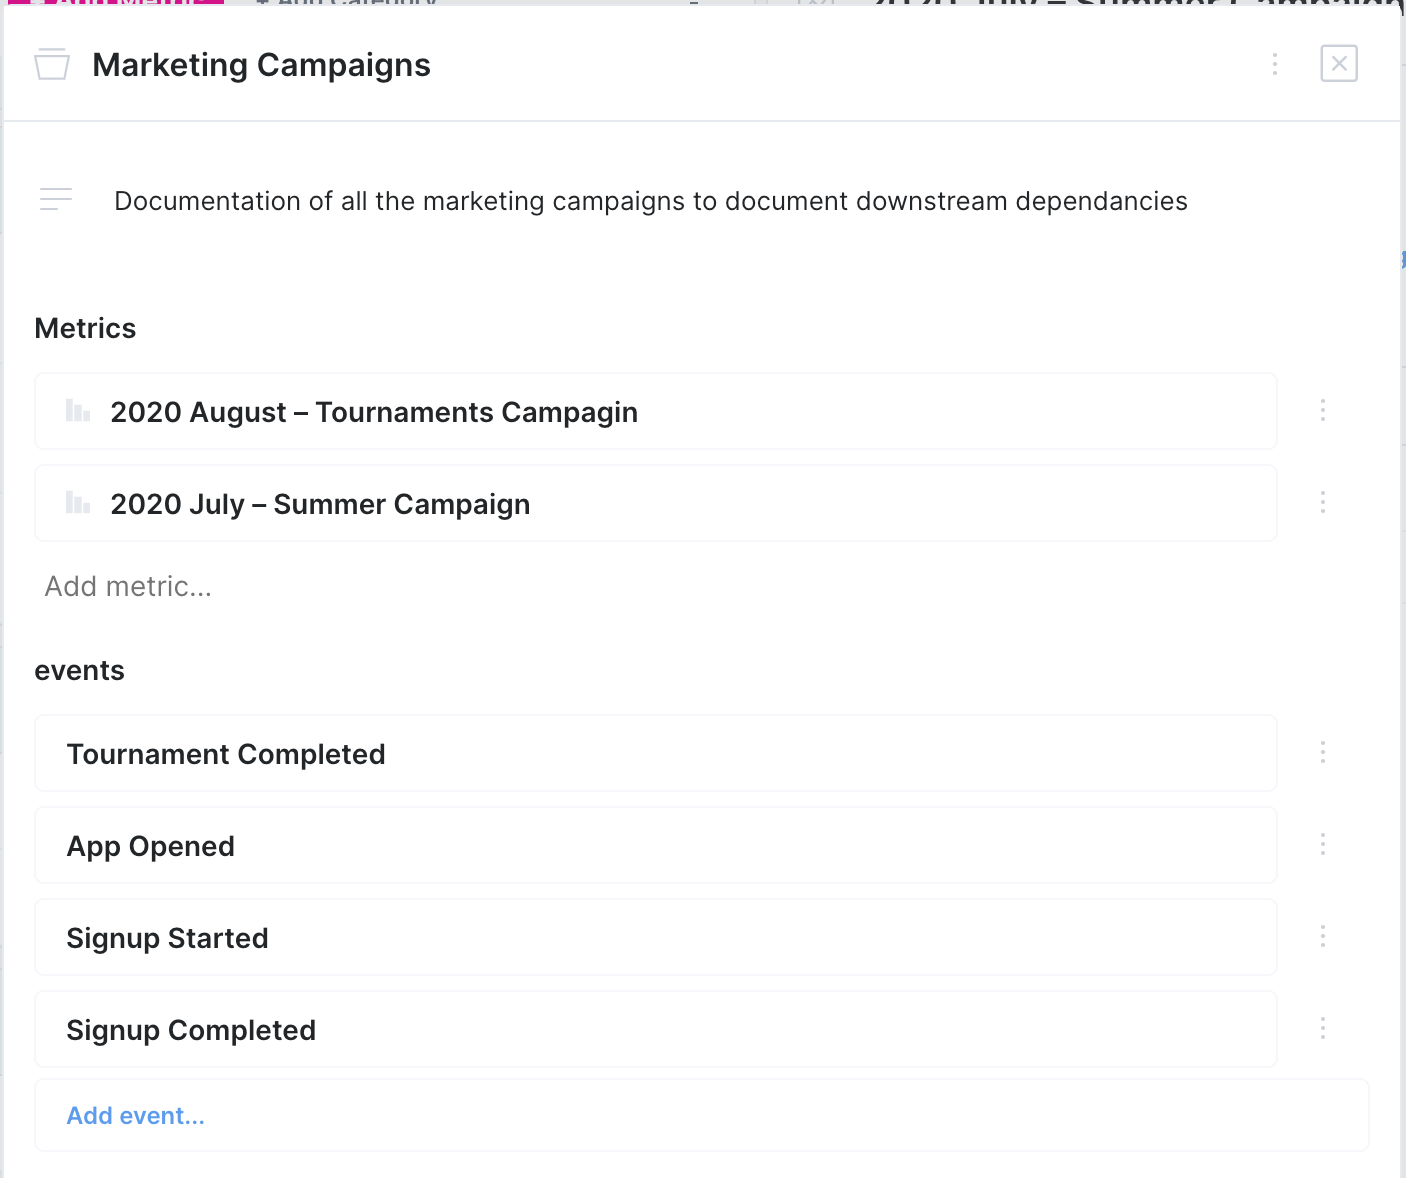
Example: A high level marketing campaign category
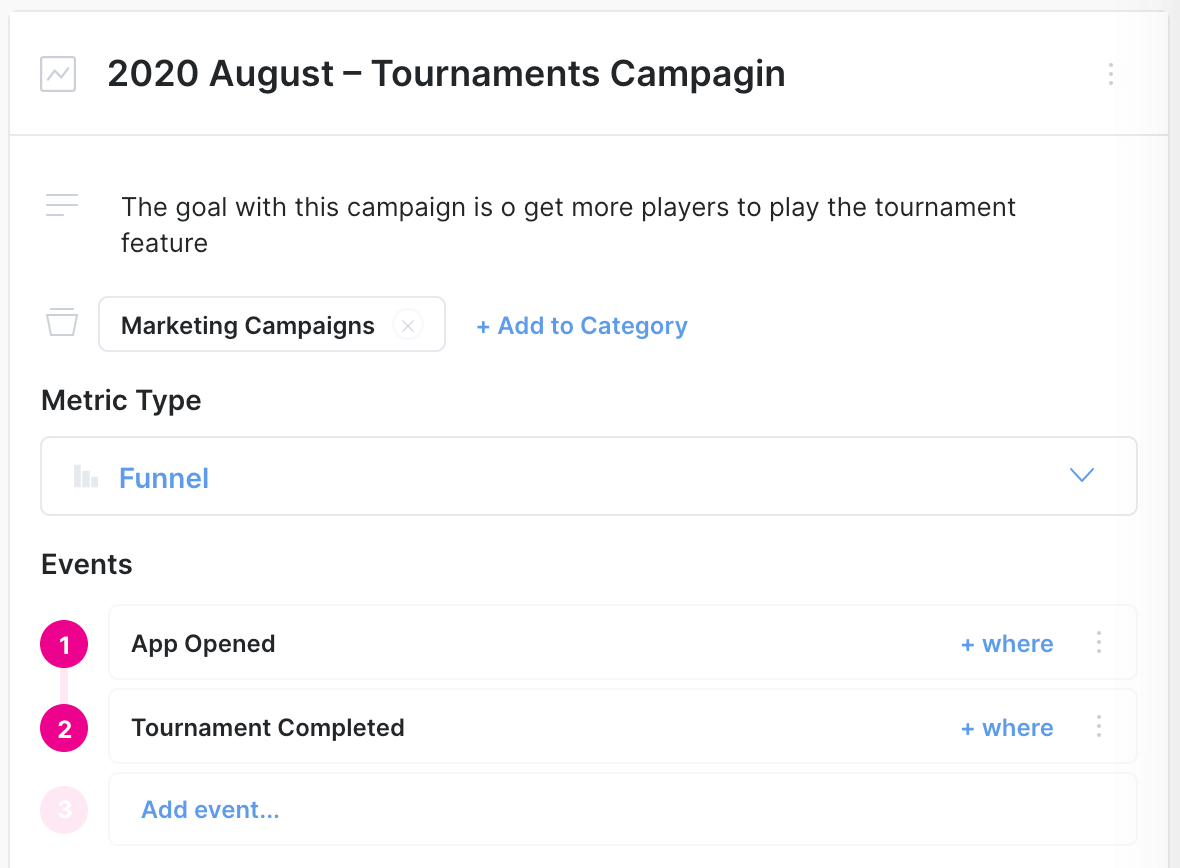
Example: A single marketing campaign as a metric
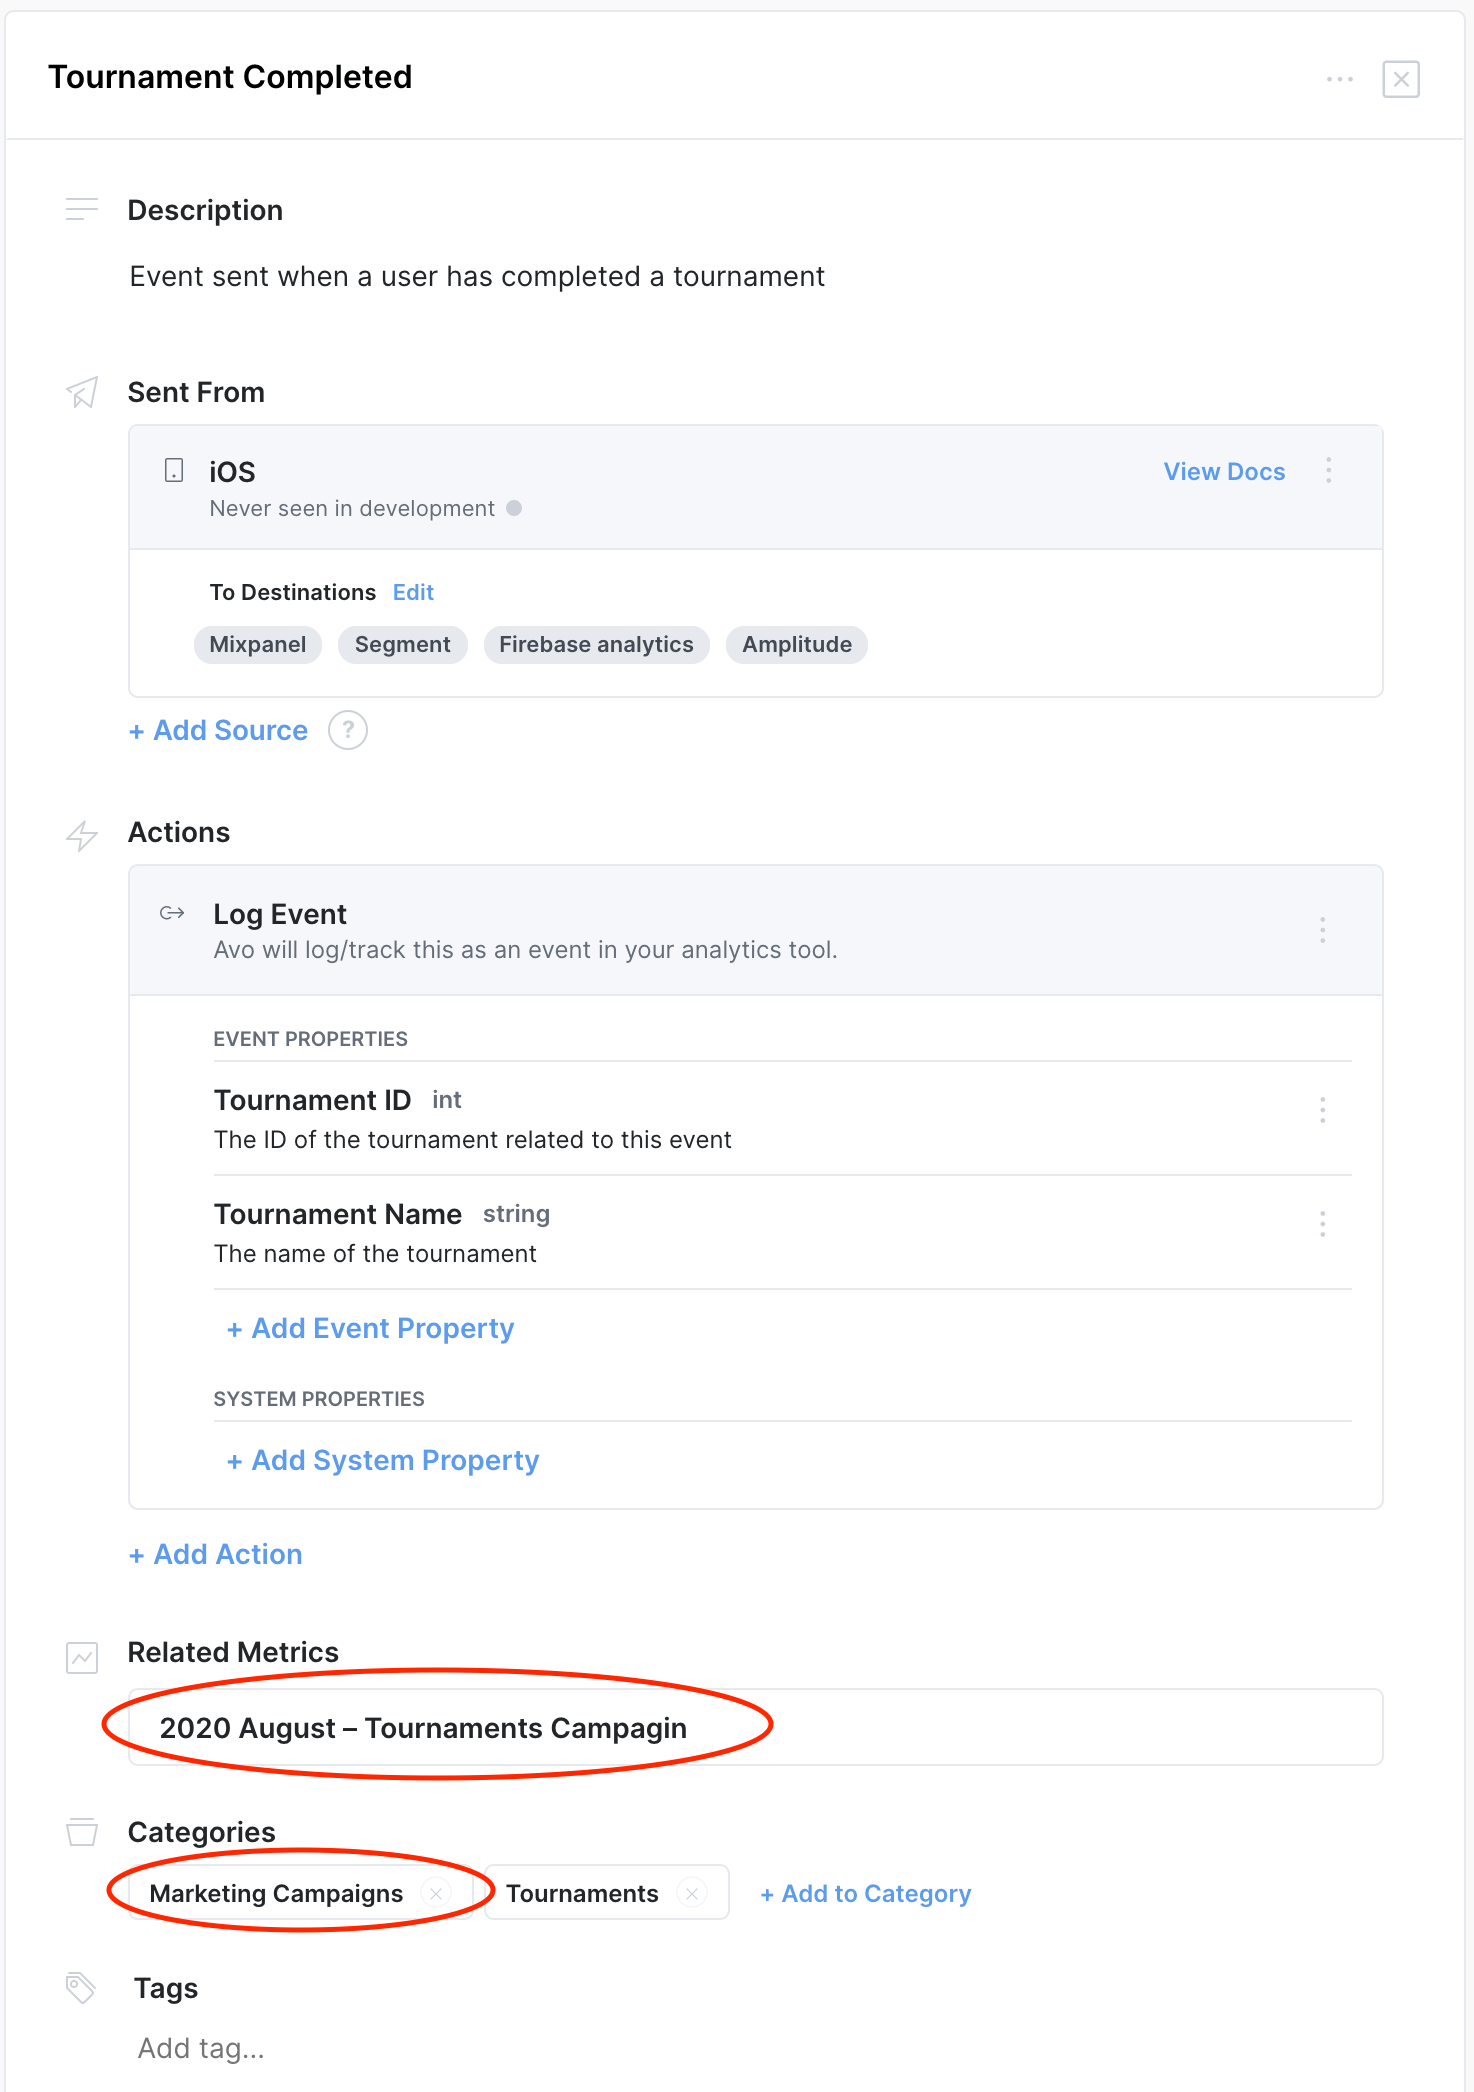
Example: Event view for a high level marketing category
Category per Marketing Campaign
Another way to associate marketing campaigns with your events in Avo is to create a category per marketing campaign. That is a good way for teams that want more granular campaign documentation and have more than one metric they want to document for each marketing campaign.
To create a category per marketing campaign:
- Go into the Metrics tab of the Tracking Plan
- Click ”+ Add Category”
- Give your category a name (e.g 2020 – Tournaments Campaign) and a description
- Create a metric for each KPI for that marketing campaign
- (Optional) Add events that are significant for this marketing campaign to the category
This way you will be able to see that the event is a part of a specific marketing campaign category in the event view, as well as all the marketing campaign metrics it’s associated with.
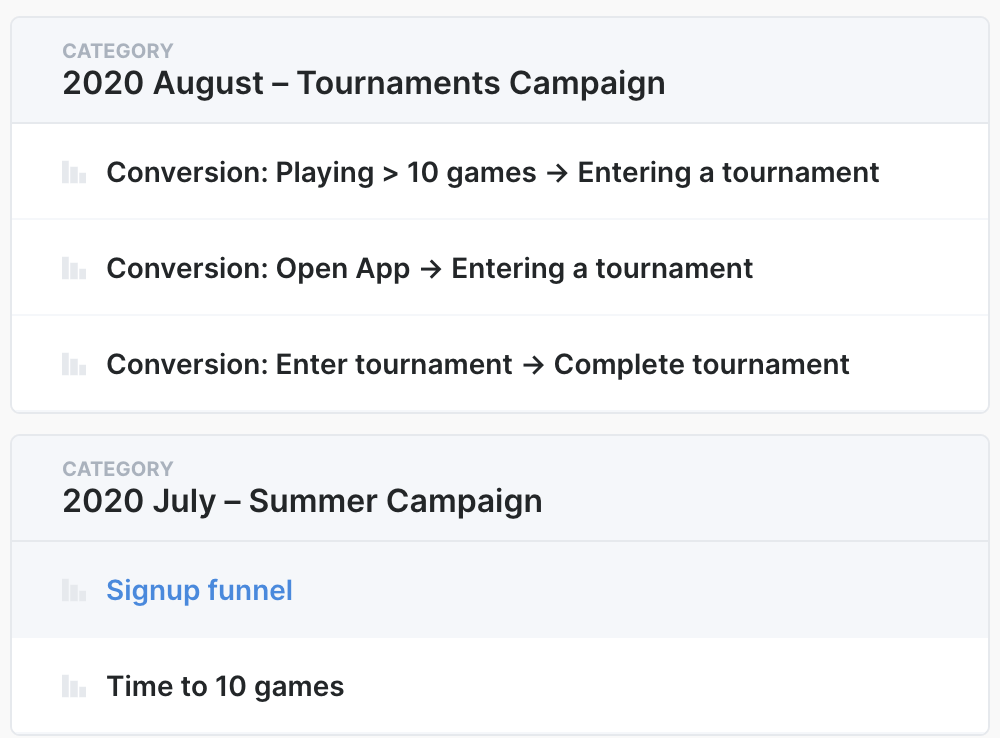
Example: A marketing campaign per category
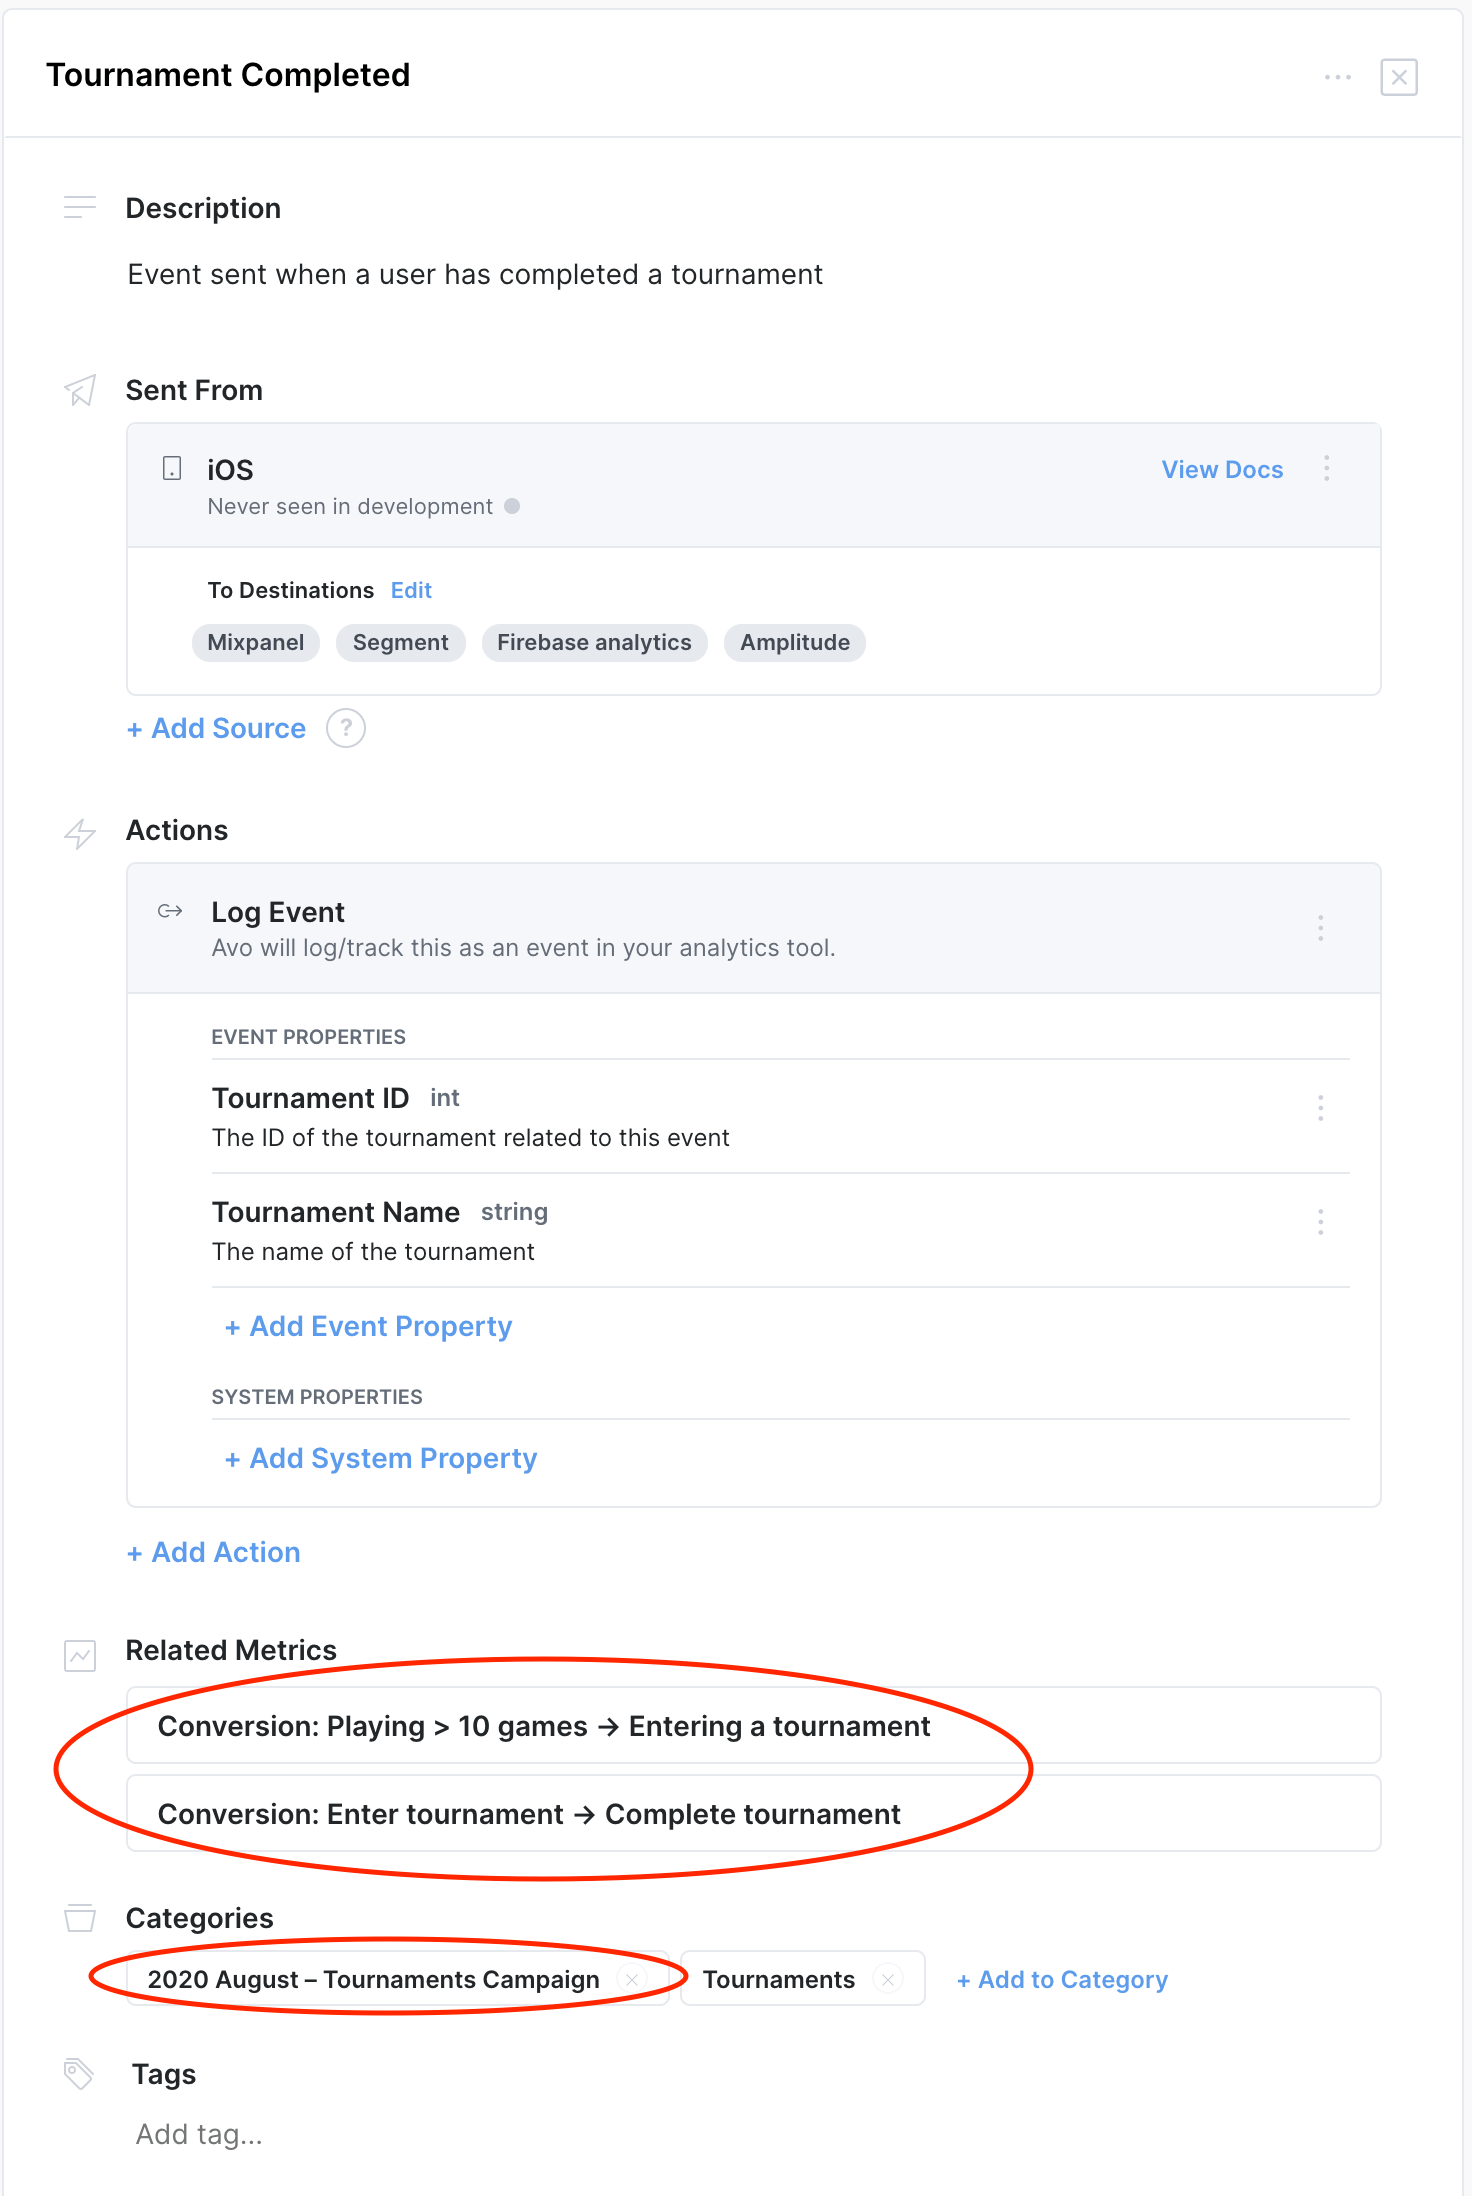
Example: Event view for a marketing campaign per category
KPI dashboards
Another common dependency are KPI dashboards that use data from your product analytics. Those kind of dashboards are very important not to mess up and it’s good to make that clear in context with the event definitions that this event is used in a KPI dashboards so it needs extra caution when making changes to it. In the examples below we will both be using categories and tags to document KPI dashboard dependencies.
KPI dashboard as a category
This way you have a category that contains all the KPIs as metrics, and both the category and the metrics will be associated with the events.
To create a KPI dashboard category:
- Go into the Metrics tab of the Tracking Plan
- Click ”+ Add Category”
- Give your category a name (e.g KPI dashboard) and a description
- Create metrics for each individual KPI
- (Optional) Add events that are significant for the KPI dashboard to the category
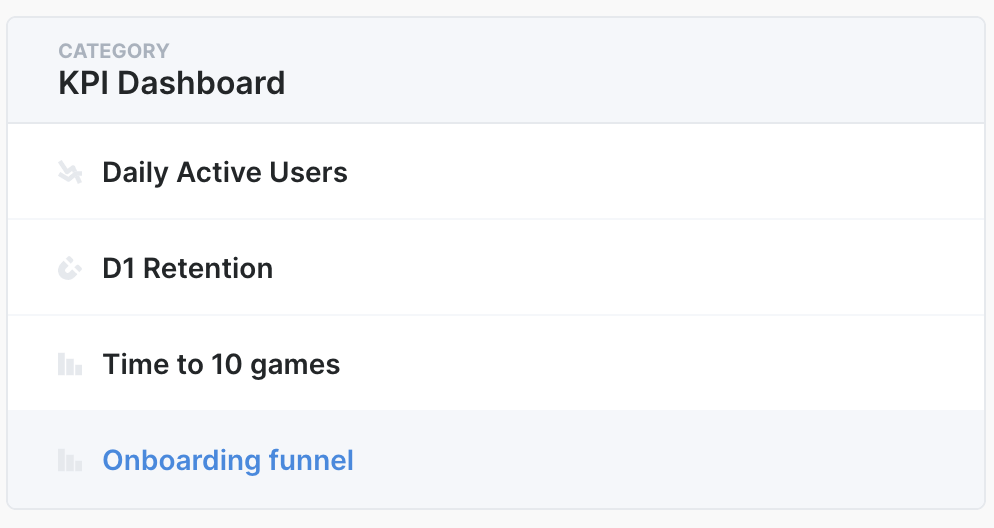
Example: A KPI dashboard category
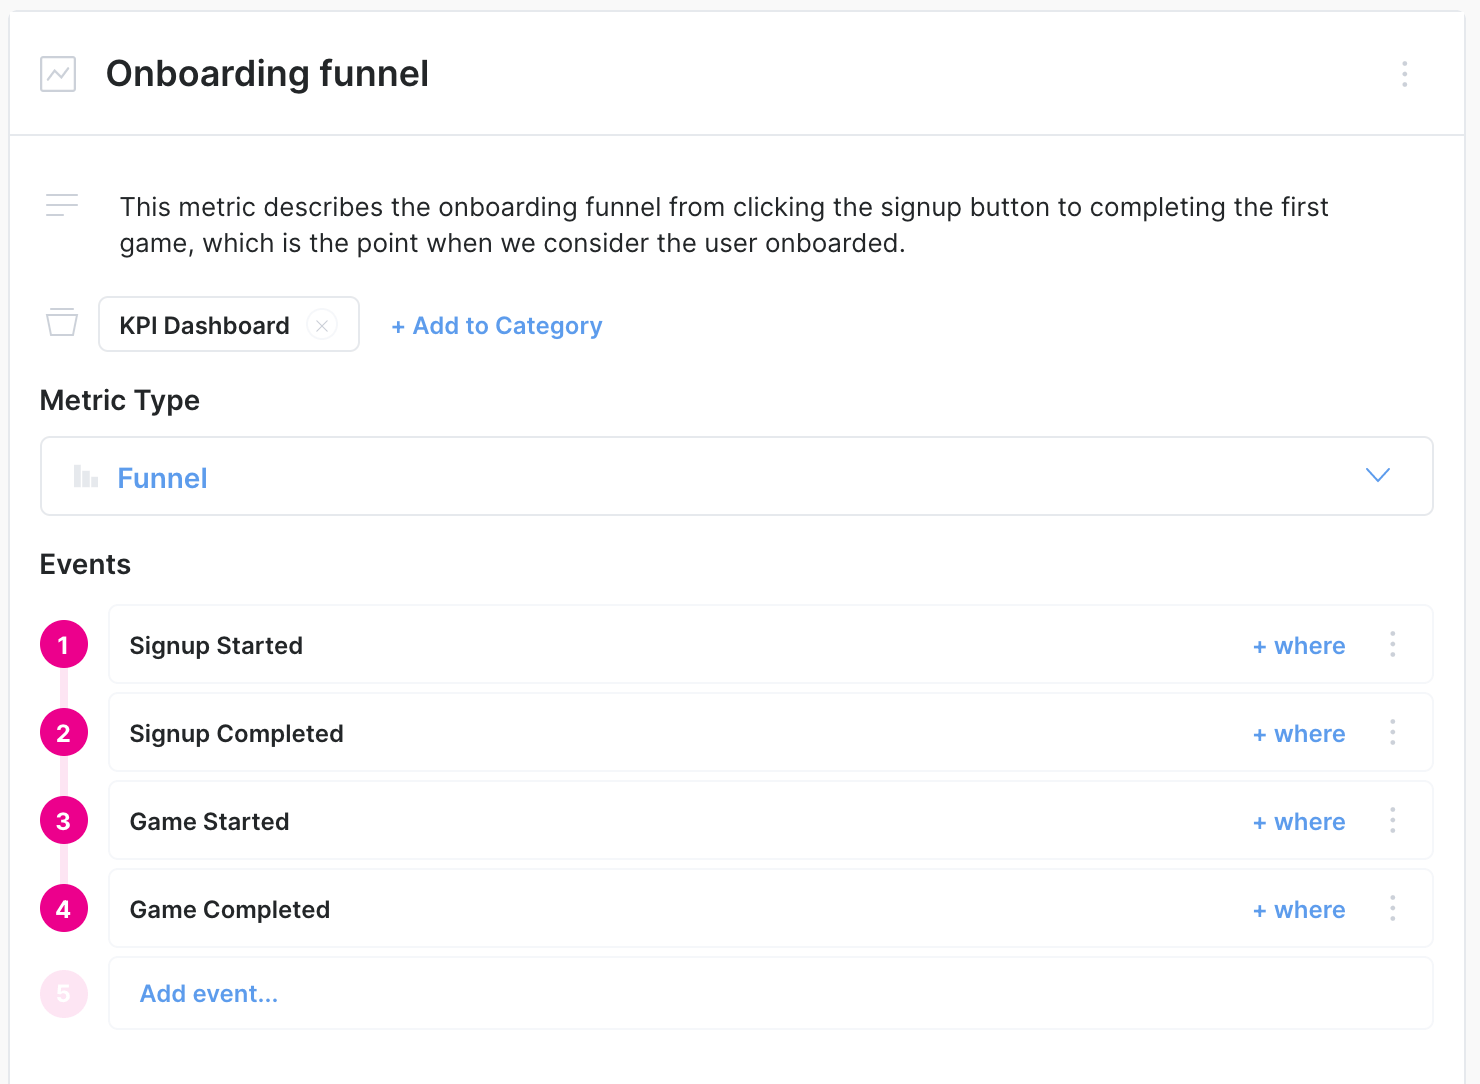
Example: A metric representing one KPI of the KPI dashboard
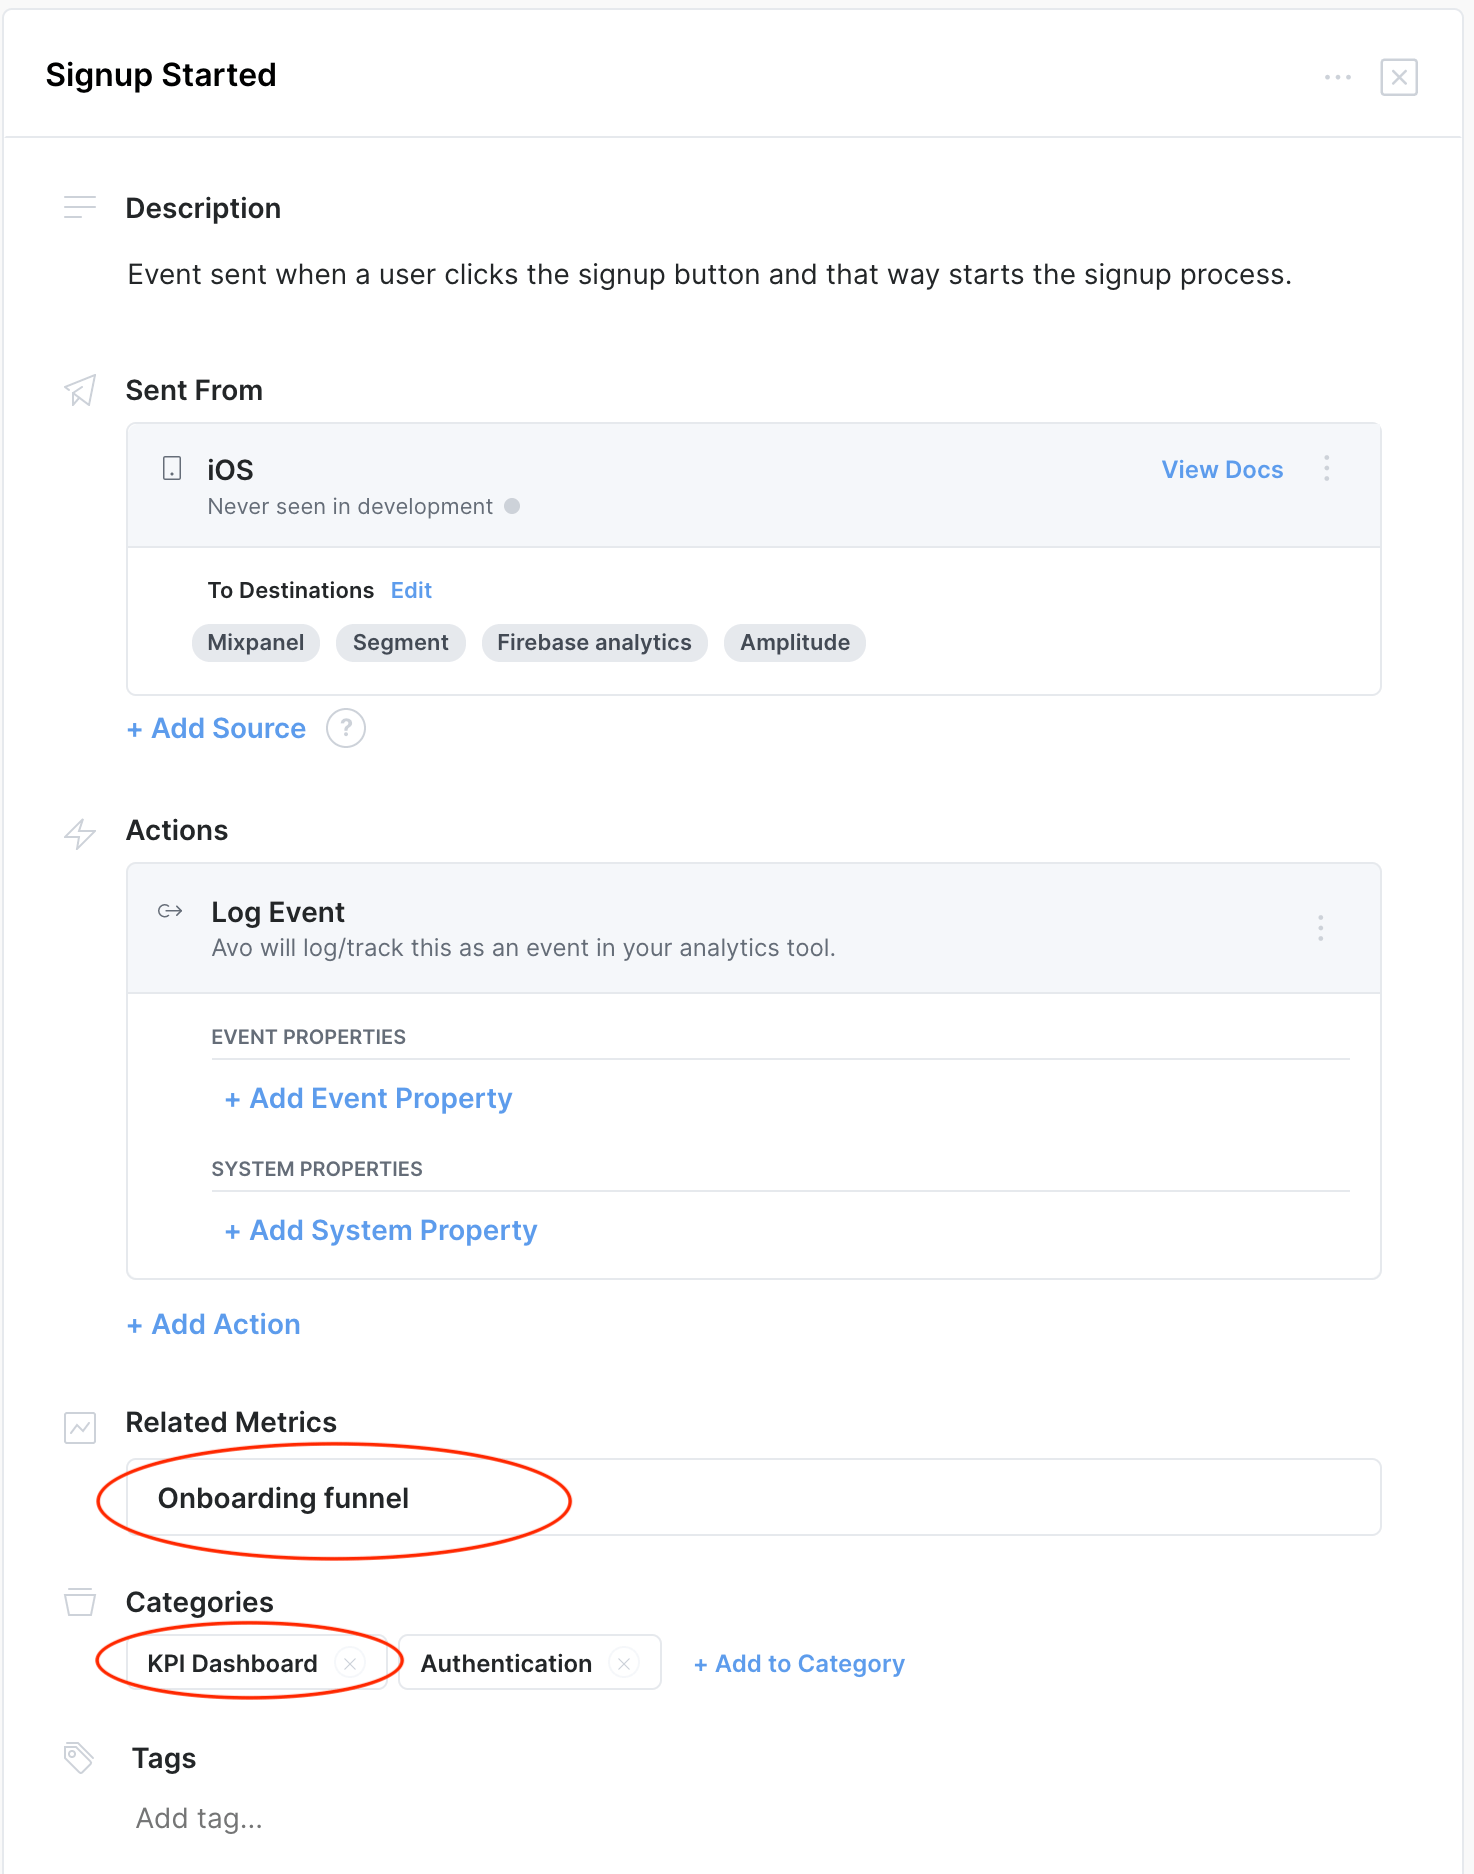
Example: Event view for a KPI dashboard category
KPI dashboard as a tag
Another way to indicate that a KPI dashboard depends on an event is using tags. We still recommend defining each KPI as a metric, but they don’t necessarily have to be in a KPI dashboard category.
To create a KPI dashboard tag:
- Go into the desired event
- Scroll down to the bottom of the event view and click “Add tag…”
- Give the tag a name (e.g.. KPI dashboard)
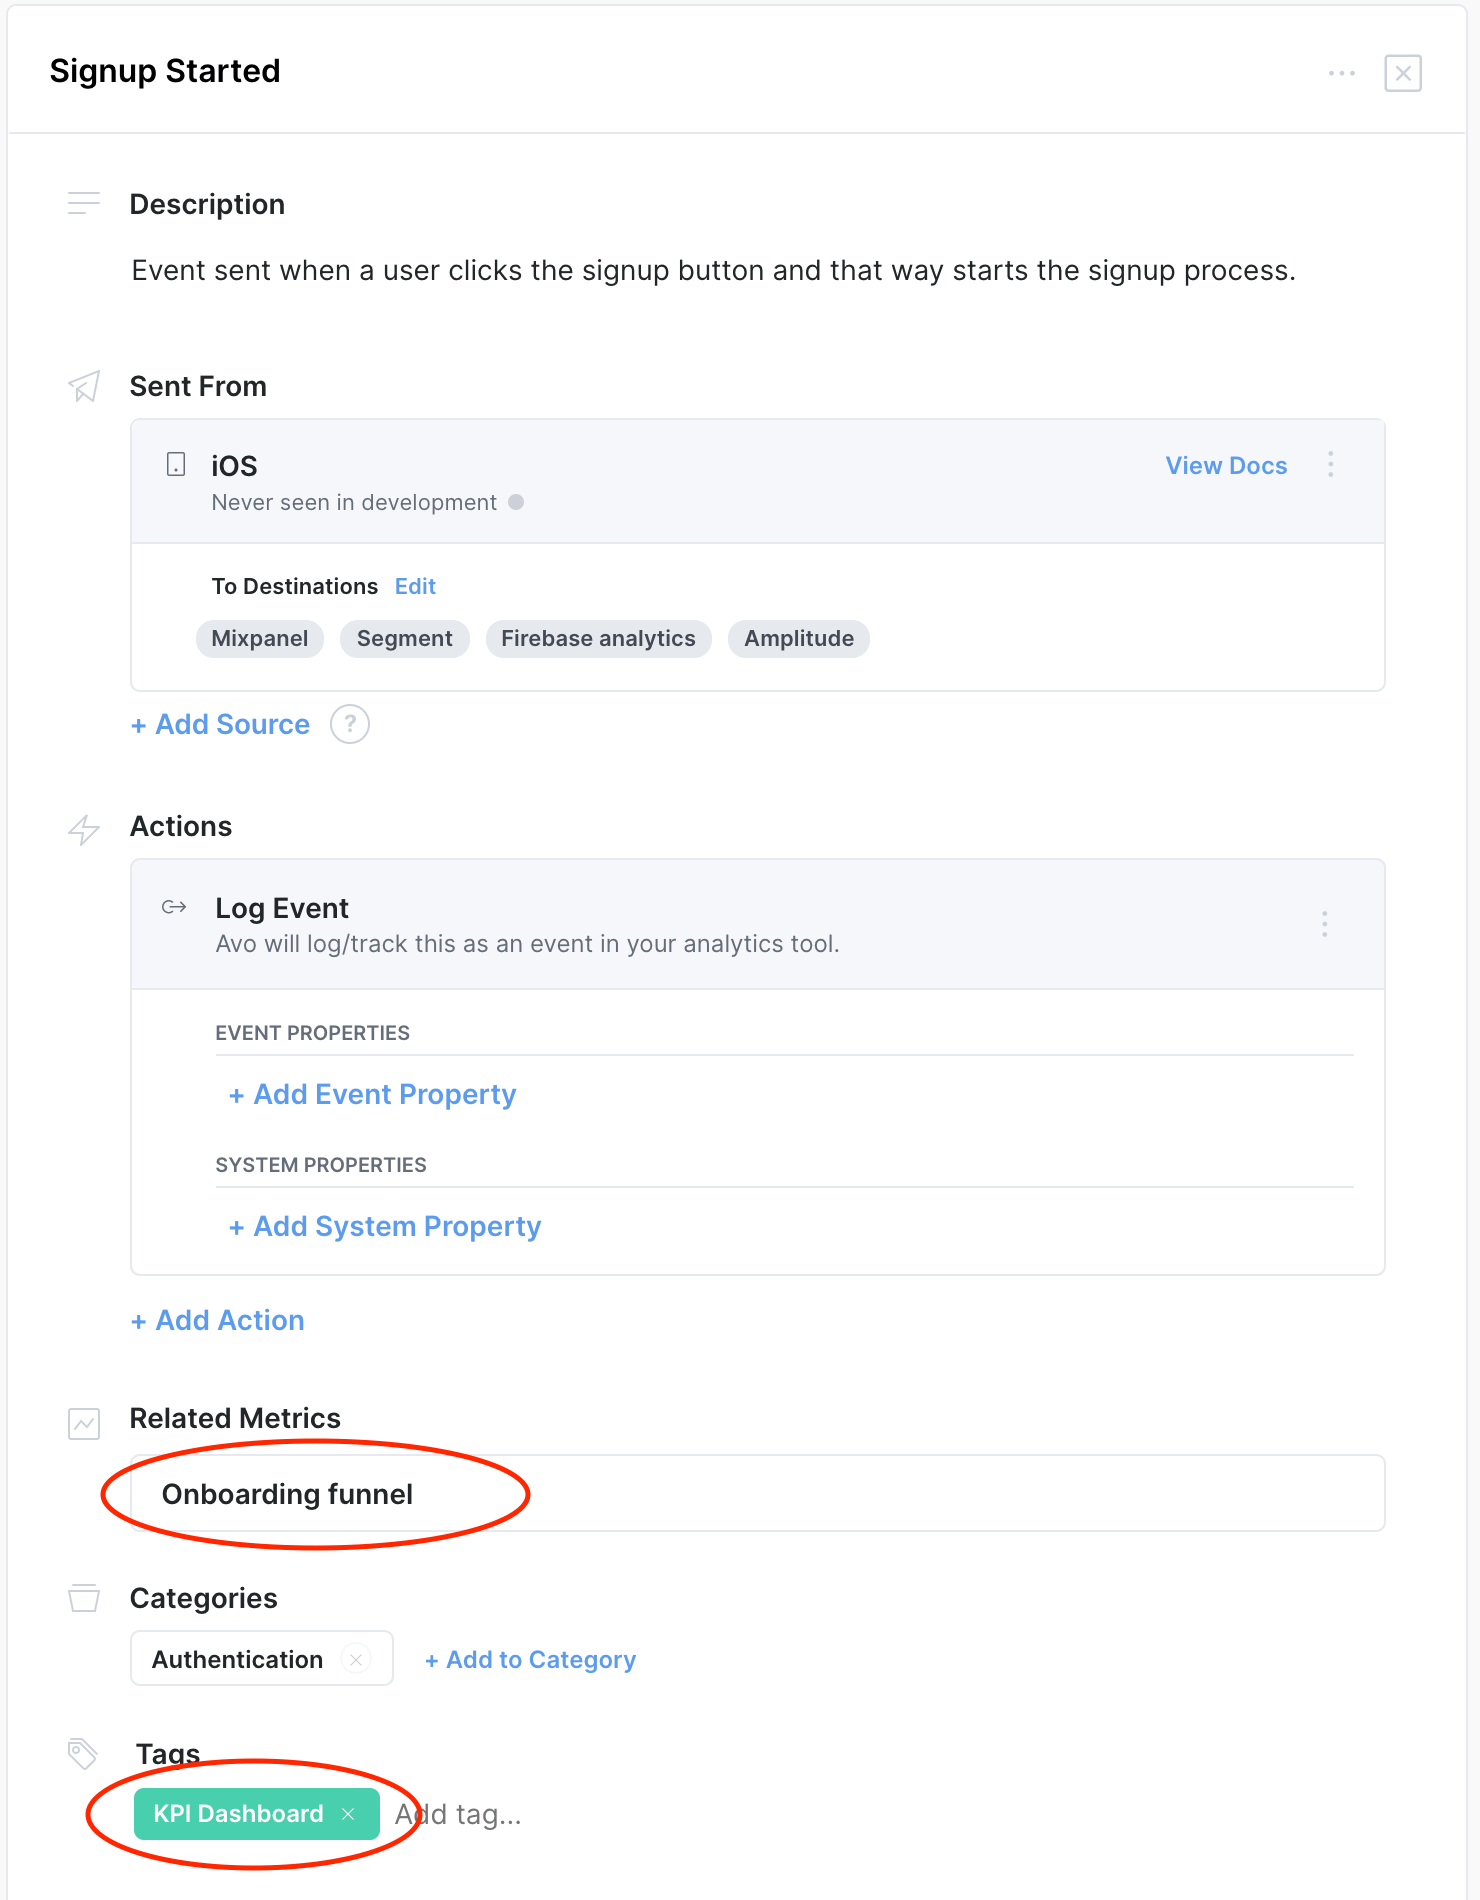
Example: Event view for a KPI dashboard tag